


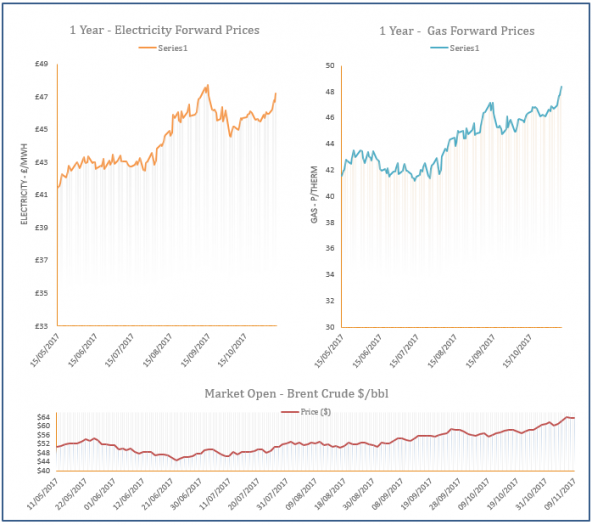
Energy Market Analysis - 09-11-2017
9th November 2017 | Posted by: Daniel Birkett | Market Analysis
Gas price stabilised yesterday afternoon as a slight drop in demand levels was forecast for today. However, short-term forecasts point to below average temperatures and safety checks at French nuclear facilities provide on-going support to both markets. Further out, a drop in coal prices helped to weigh on some contracts despite another rebound on the oil market.

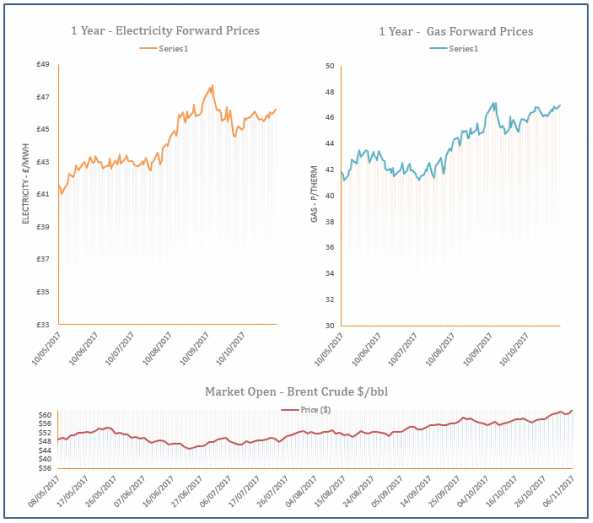
Energy Market Analysis - 08-11-2017
8th November 2017 | Posted by: Daniel Birkett | Market Analysis
Cold weather pushed near-curve gas contracts higher on Tuesday, with low nuclear availability in France also a factor, as extra gas-fired generation will be required to make up the shortfall. Meanwhile, bullish movement on the oil market eased in the afternoon, helping to erase some of the morning’s gains.

Energy Market Analysis – 07-11-2017
7th November 2017 | Posted by: Daniel Birkett | Market Analysis
Gas prices increased on Monday following strong growth on the oil market and a rebound in coal prices. Cold temperatures continued to lift demand levels in the UK which resulted in a short system in the afternoon, requiring an increase in storage withdrawals.
Energy Market Analysis - 06-11-2017
6th November 2017 | Posted by: Daniel Birkett | Market Analysis
Demand levels were above the seasonal norm at the end of last week but improved Norwegian supply helped to curb some of the upward movement as the system was long throughout the session. The far-curve also displayed some losses in the afternoon on the back of a drop in coal prices.

Energy Market Analysis - 03-11-2017
3rd November 2017 | Posted by: Daniel Birkett | Market Analysis
Increased CCGT generation and higher LDZ demand led to increases across the near gas curve on Thursday. The system was oversupplied on the back of improved Norwegian flows which capped the gains somewhat, while the far-curve was pushed higher by rising coal.