


Energy Market Analysis - 28-02-2017
28th February 2017 | Posted by: Daniel Birkett | Market Analysis
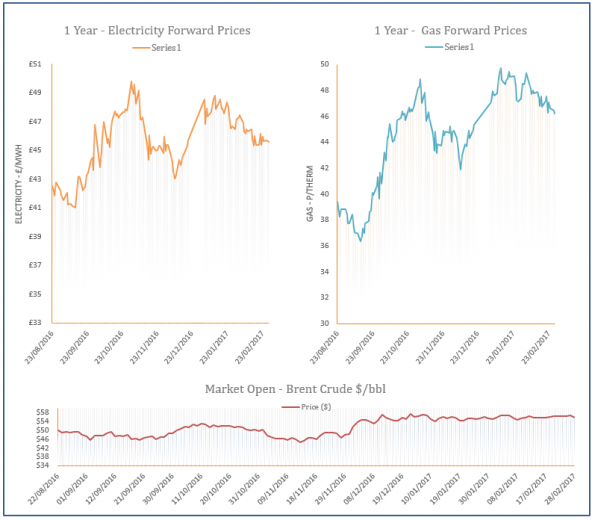
Gas prices moved down on Monday as mild temperatures will continue to weigh on demand levels this week, while an increase in wind will also reduce gas-fired power generation. LNG supply increased, helping towards a long system, while a drop in coal prices provided further downward pressure on the far-curve.
Energy Market Analysis - 27-02-2017
27th February 2017 | Posted by: Daniel Birkett | Market Analysis
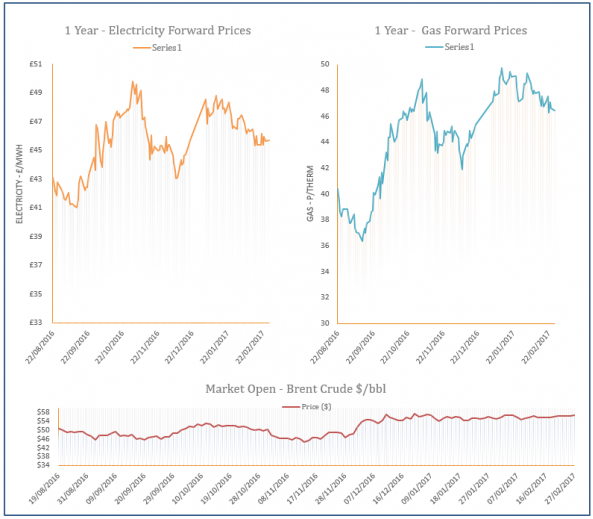
Near-curve gas prices moved down on Friday with direction coming from a mild weather forecast. Bearish movement was also displayed at the back of the curve with weaker oil and coal markets helping to weigh on contracts. In terms of supply, three LNG deliveries are expected to arrive in the UK this week, contributing to further downward pressure.
Energy Market Analysis - 24-02-2017
24th February 2017 | Posted by: Daniel Birkett | Market Analysis
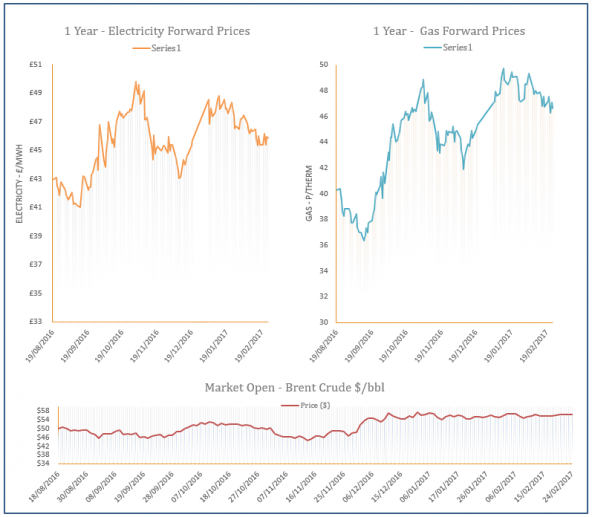
Gas prices climbed higher across the curve during Thursday’s session, with a higher demand outlook for today helping towards gains on the prompt. A temporary drop in temperatures was expected today and over the weekend, while weaker wind levels will also result in a rise in CCGT generation.
Energy Market Analysis - 23-02-2017
23rd February 2017 | Posted by: Daniel Birkett | Market Analysis
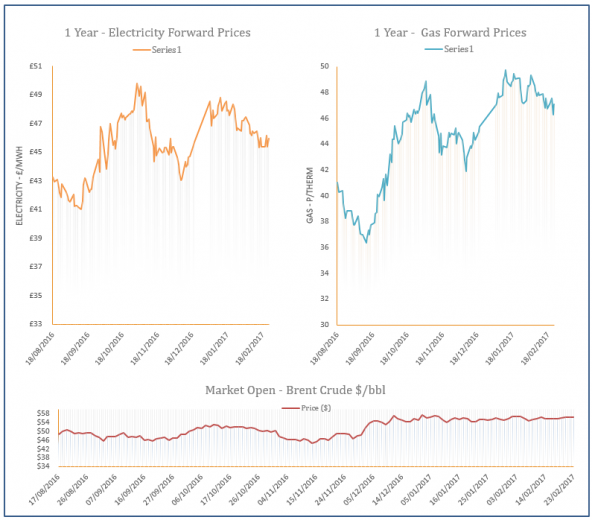
Gas prices fell to their lowest point in 2017 so far yesterday morning on the back of the mild weather forecast. However, prices recovered in the afternoon as a long system resulted in an increase in storage injections and a drop in withdrawals. Meanwhile, the Euro strengthened against the Pound, providing further bullish sentiment.

Energy Market Analysis - 22-02-2017
22nd February 2017 | Posted by: Daniel Birkett | Market Analysis
A mild weather outlook for this week helped to restrict bullish movement at the front of the gas curve yesterday, with improved wind levels also helping to reduce gas-fired generation. Meanwhile, an increase in Norwegian flows to Europe contributed to a long gas system, resulting in higher exports via the IUK pipeline to Belgium. Upward movement further along the curve was limited by a bullish oil market, although a stronger Pound restricted any gains.