


Energy Market Analysis - 17-08-2017
17th August 2017 | Posted by: Daniel Birkett | Market Analysis
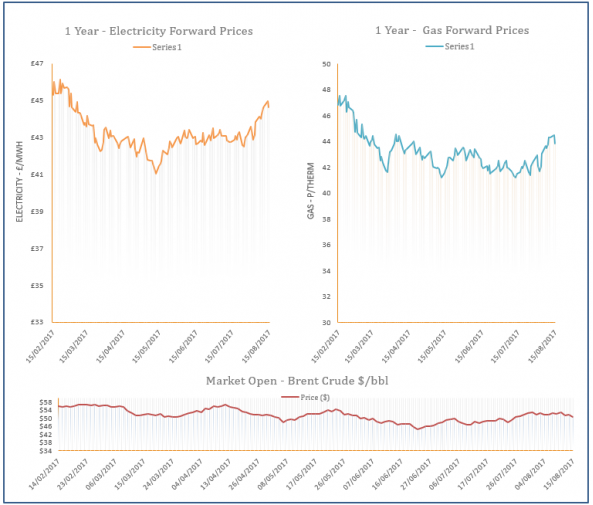
Gas contracts added to their price on Wednesday with unplanned outages continuing to impact supply levels; maintenance at the Gullfaks field in Norway reduced flows by 6.7mcm. Weaker oil did little to restrict upward movement further along the curve as coal strengthened significantly.

Energy Market Analysis - 16-08-2017
16th August 2017 | Posted by: Daniel Birkett | Market Analysis
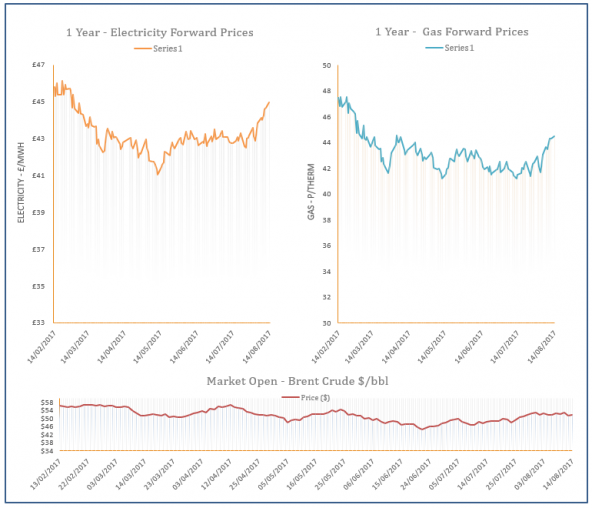
Gas prices moved down on Tuesday following a rise in Norwegian supply which resulted in a long system. LNG nominations at South Hook also ramped up and weaker coal & oil markets helped to pressure down contracts on the far-curve.
Energy Market Analysis - 15-08-2017
15th August 2017 | Posted by: Daniel Birkett | Market Analysis
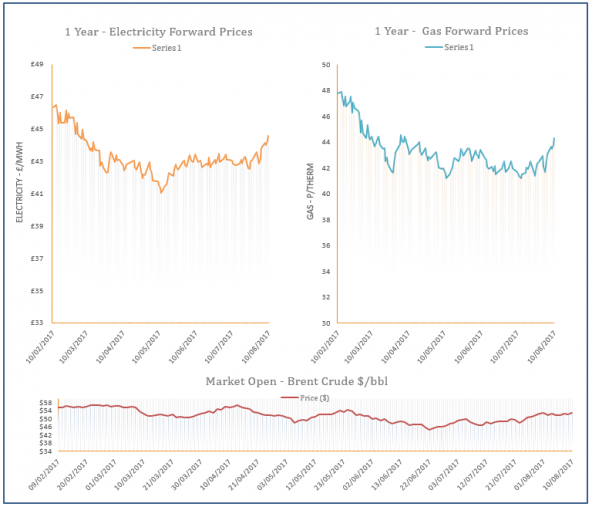
A long system resulted in downward movement across the front of the curve yesterday, with falling oil weighing on prices further out. An increase in Norwegian and UKCS flows contributed to the oversupplied system, although imports via Langeled were still slightly restricted.
Energy Market Analysis - 14-08-2017
14th August 2017 | Posted by: Daniel Birkett | Market Analysis
Gains were recorded across the gas curve on Friday as the system fell short due to on-going outages in the North Sea. This drop in supply helped contracts rebound after a bearish opening, with oil failing to offer much support in either direction.
Energy Market Analysis - 11-08-2017
11th August 2017 | Posted by: Daniel Birkett | Market Analysis
Gas price displayed gains on Thursday as a result of unplanned outages affecting UKCS and Norwegian output. LNG send-outs were also slightly weaker and bearish oil prices had little impact on the far-curve.