


Energy Market Analysis – 03-10-2018
3rd October 2018 | Posted by: Daniel Birkett | Market Analysis
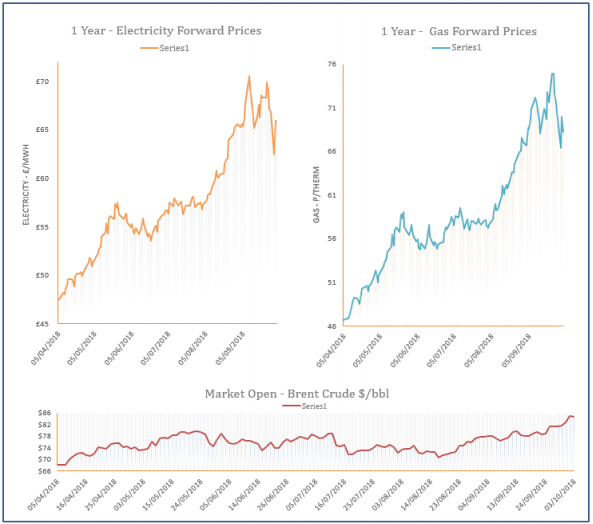
Gas prices decreased on Tuesday with a rise in Norwegian flows and a drop in exports contributing to an oversupplied system. Oil prices also stabilised, while coal and carbon markets eased down, applying bearish pressure to the far-curve.
Energy Market Analysis – 02-10-2018
2nd October 2018 | Posted by: Daniel Birkett | Market Analysis
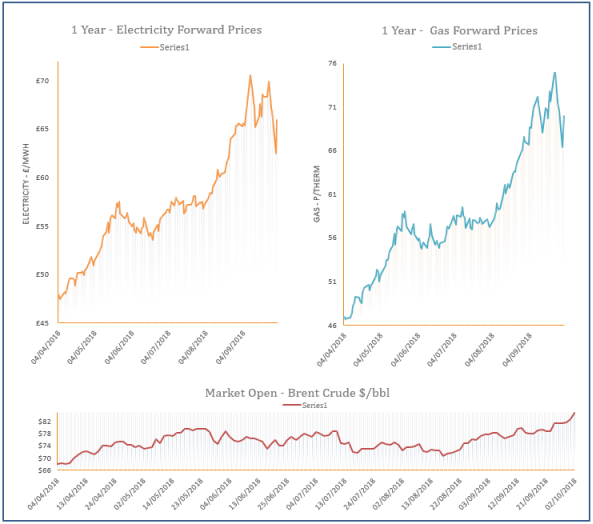
Gas prices fluctuated across the curve during Monday’s session with strong losses displayed in the morning due to an oversupplied system, helped by healthy renewables. However, strengthening oil prices assisted gas contracts in their recovery in the afternoon.
Energy Market Analysis – 01-10-2018
1st October 2018 | Posted by: Daniel Birkett | Market Analysis
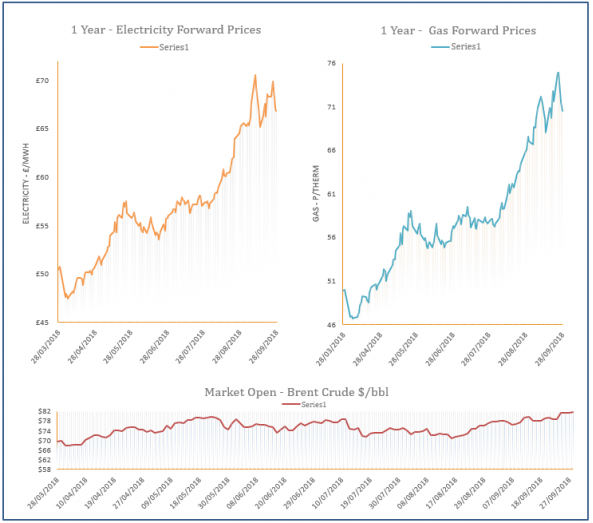
Friday was the final day of trading for the 2017/18 gas year and saw prices decrease across the curve, with traders taking profits despite overall market sentiment appearing bullish. Norwegian flows remained weak, while coal, carbon and oil markets increased.