


Energy Market Analysis - 20-12-2018
20th December 2018 | Posted by: Natalie Ormrod | Market Analysis
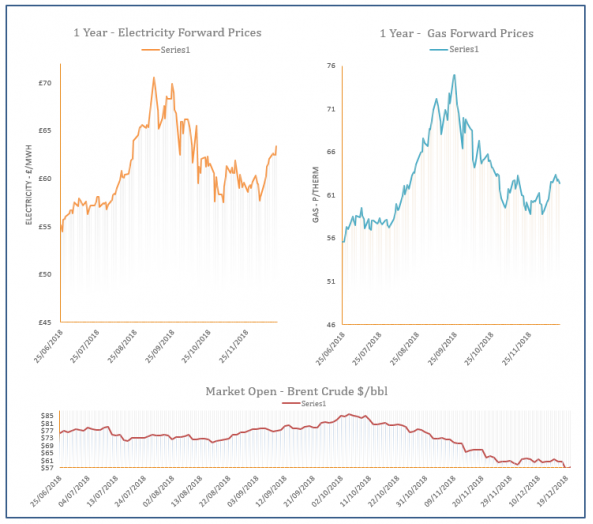
The system is short this morning, back to lows from previous days amid rising US interest rates. Gas is trading flat to the close despite this, as the broader complex is under pressure.
Energy Market Analysis - 19-12-2018
19th December 2018 | Posted by: Natalie Ormrod | Market Analysis
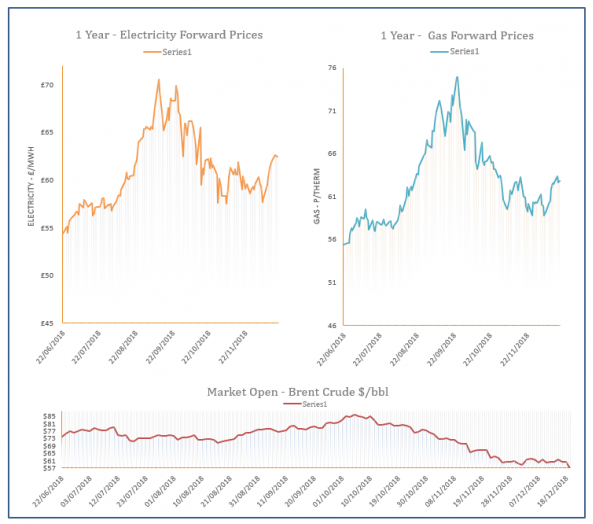
Prices fell yesterday driven down by a fall in spot prices, while the forward curve tracked the falling oil prices. Milder weather, increased wind generation and a bearish oil market all had an impact on prices.

Energy Market Analysis – 18-12-2018
18th December 2018 | Posted by: Lawrence Carson | Market Analysis
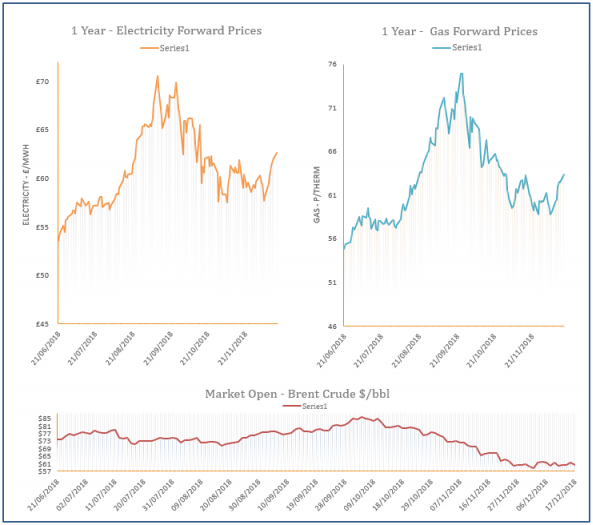
Early gains were slashed in European gas prices on Monday due to an upward revision in temperature forecasts and comfortably supplied gas systems. Although strong EUA prices continued to be supportive for the gas curve on the back of the expiry of the Dec 18 contract.
Energy Market Analysis – 17-12-2018
17th December 2018 | Posted by: Daniel Birkett | Market Analysis
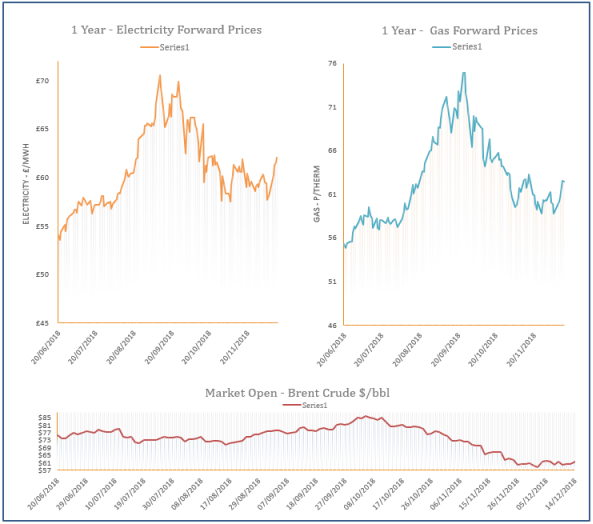
Gas contracts climbed higher on Friday with support coming from the overall bullish trend on energy markets, with rising carbon the main driver of prices. Oil was the exception to the upward movement but failed to have much impact.
Energy Market Analysis – 14-12-2018
14th December 2018 | Posted by: Daniel Birkett | Market Analysis
Gas prices climbed higher yesterday, with the larger gains displayed at the front of the curve. A colder weather outlook for the coming days offered support to the near-curve, however, a long system provided some bearish resistance. Further out, prices were pushed higher by carbon and oil markets.