


Energy Market Analysis – 13-12-2018
13th December 2018 | Posted by: Daniel Birkett | Market Analysis
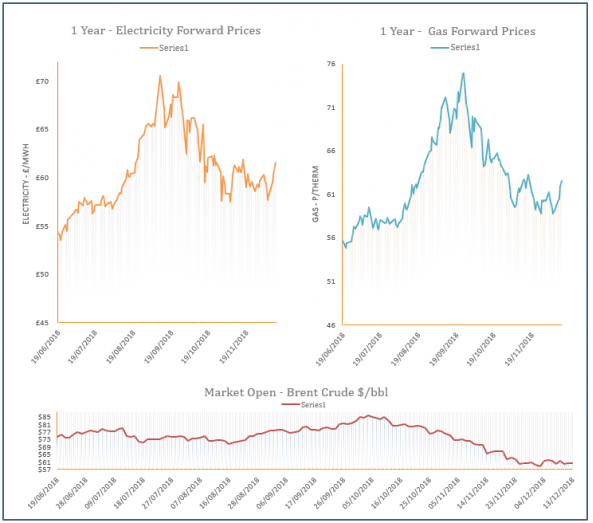
Gas prices climbed higher across the curve on Wednesday, ignoring a healthy supply outlook and a weaker oil market. Instead, contracts found support from the expected cold stint and a rise in coal and carbon markets.
Energy Market Analysis – 12-12-2018
12th December 2018 | Posted by: Daniel Birkett | Market Analysis
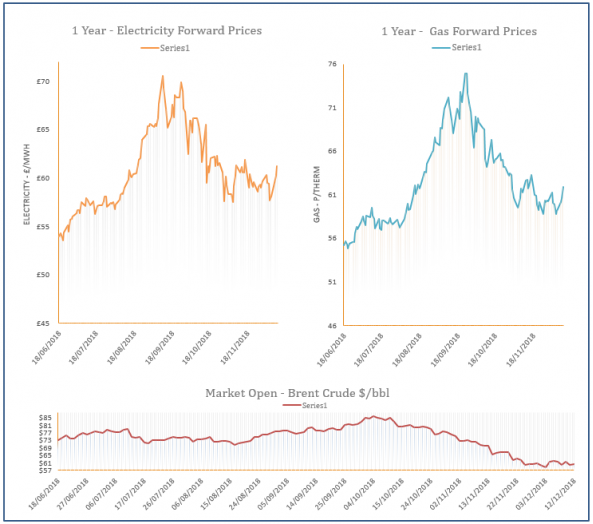
Gas prices climbed higher on Tuesday with the larger gains displayed at the front of the curve. A rise in coal and oil helped to lift prices, although an expected rise in wind generation weighed on the prompt as this should reduce demand for gas-fired power.
Energy Market Analysis – 11-12-2018
11th December 2018 | Posted by: Daniel Birkett | Market Analysis
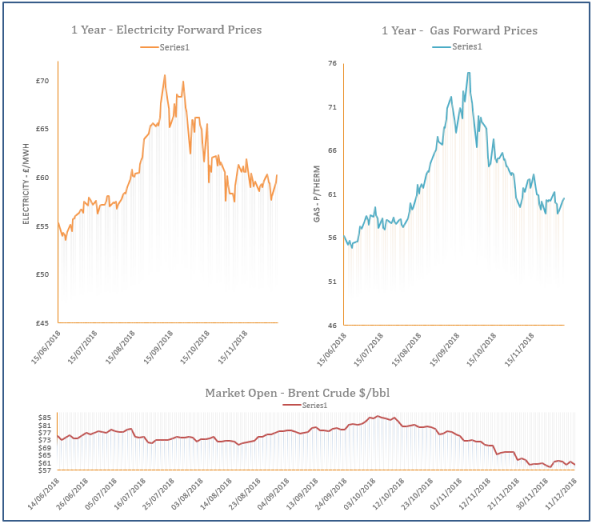
Gas prices climbed higher during Monday’s session with a short system offering support to the front of the curve. Meanwhile, the back of the curve was pushed higher by coal and carbon markets, while a delay to the Brexit vote caused the Pound to fall, providing additional bullish pressure.
Energy Market Analysis – 10-12-2018
10th December 2018 | Posted by: Daniel Birkett | Market Analysis
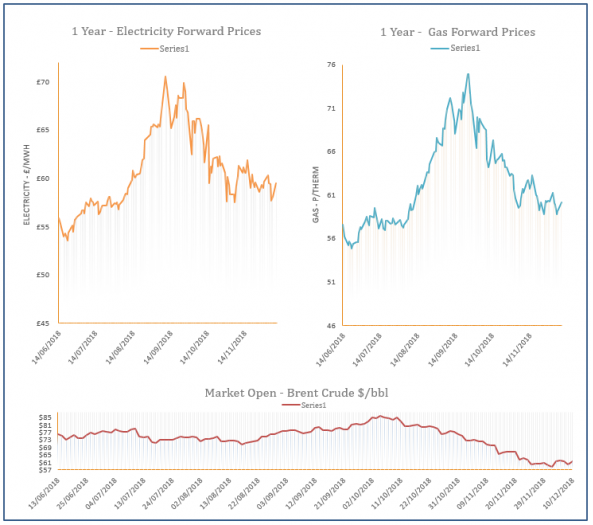
Gas prices closed the week lower despite a small gain on Friday which was sparked by strengthening on the oil market. However, overall sentiment at the front of the curve remained bearish due to a healthy supply outlook as outages in Norway were scheduled to end over the weekend.

Energy Market Analysis – 07-12-2018
7th December 2018 | Posted by: Daniel Birkett | Market Analysis
Gas prices moved down yesterday despite an undersupplied system at the start of the session, as a mild weather forecast, an increase in wind levels and weaker commodity markets offered bearish pressure.