


Energy Market Analysis - 14-03-2018
14th March 2018 | Posted by: Daniel Birkett | Market Analysis
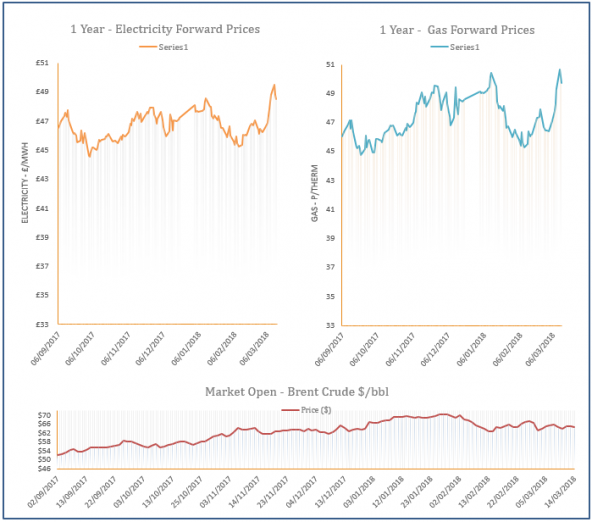
Near-curve gas prices decreased on Tuesday but were yet to completely erase the strong gains recorded on Monday. Cold temperatures are expected at the start of next week but milder weather is forecast to return before the month is out. A drop in storage withdrawals has tightened supply but flows in general were healthy. Meanwhile, a drop in oil prices provided additional bearish pressure at the back of the curve.
Energy Market Analysis - 13-03-2018
13th March 2018 | Posted by: Daniel Birkett | Market Analysis
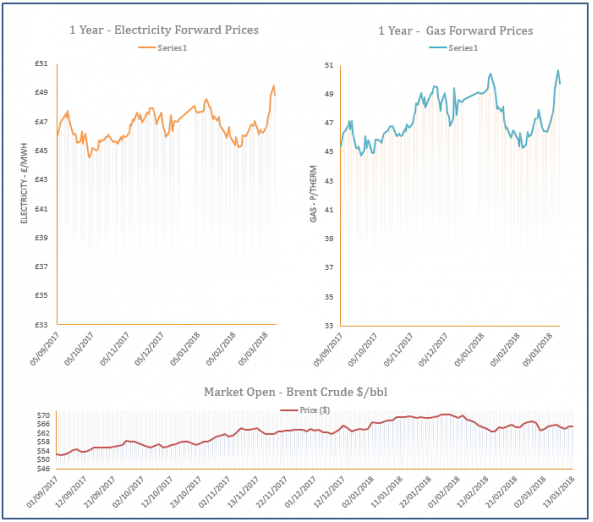
Gas prices displayed very strong gains at the start of the session but moved down in the afternoon. However, the bearish shift was short-lived as a downward revision in temperatures for next week contributed to another significant rebound. The expected surge in demand has caused concerns regarding a potential gas shortage due to low storage levels. Meanwhile, decreases on oil and coal markets limited some gains at the back of the curve.
Energy Market Analysis - 12-03-2018
12th March 2018 | Posted by: Daniel Birkett | Market Analysis
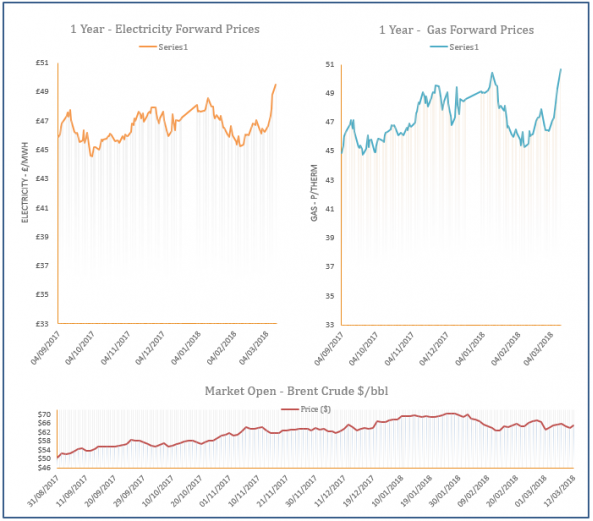
Gas prices moved higher on Friday as forecasts for the end of the month point towards more cold weather and storage levels are very low, causing supply fears. Far-curve prices increased later in the session following a rise in oil prices, while the coal market was generally stable.

Energy Market Analysis - 09-03-2018
9th March 2018 | Posted by: Daniel Birkett | Market Analysis
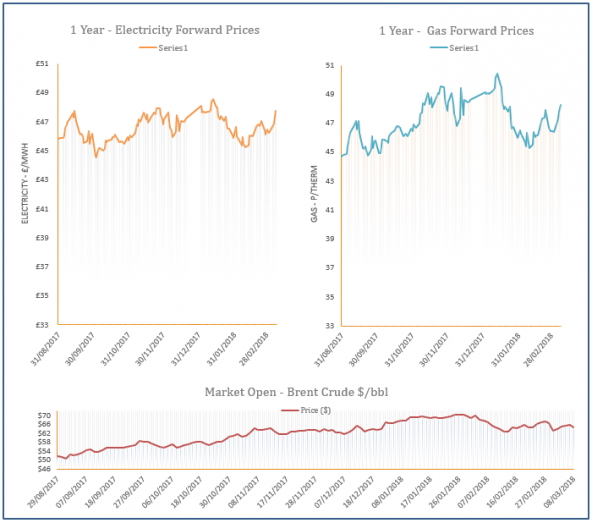
Near-curve gas prices increased on Thursday with direction coming from a colder weather outlook for the end of the month and the start of April. Storage levels are also low which has provided additional support, while LNG supply is limited by outages in Africa. Meanwhile, an issue in Norway has reduced flows to the UK today, supporting the prompt, but bullish movement at the back of the curve was capped by weaker fuel markets.
Energy Market Analysis - 08-03-2018
8th March 2018 | Posted by: Daniel Birkett | Market Analysis
A healthy supply outlook for today helped to weigh on the prompt during Wednesday’s session, although the rest of the near-curve found support from an expected drop in temperatures towards the end of the month and the start of April. Further out, prices initially opened higher but moved down later in the session following a sharp drop in oil prices.