


Energy Market Analysis – 31-01-2019
31st January 2019 | Posted by: Daniel Birkett | Market Analysis
Most gas prices fluctuated on Wednesday, displaying gains in the morning before ending the session at a loss. Cold temperatures provided support at the start of the session but healthy supply levels offered bearish pressure throughout the day.
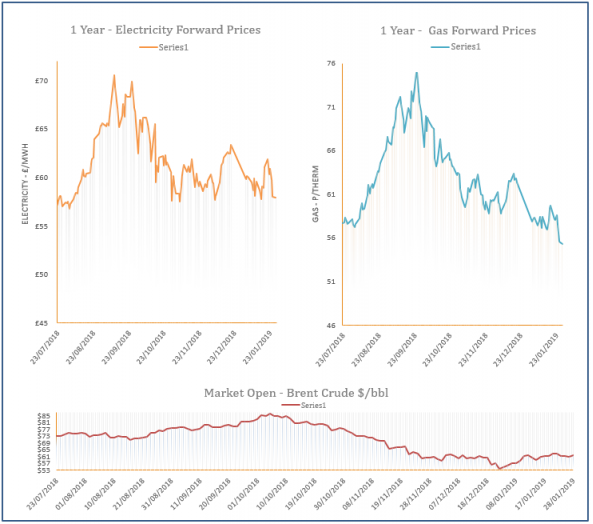
Energy Market Analysis – 30-01-2019
30th January 2019 | Posted by: Daniel Birkett | Market Analysis
Gas prices stabilised yesterday with the help of a rebound in oil which put a stop to the bearish trend displayed in the morning. Cold temperatures also offered support to the near-curve with an expected rise in demand forecast for today.
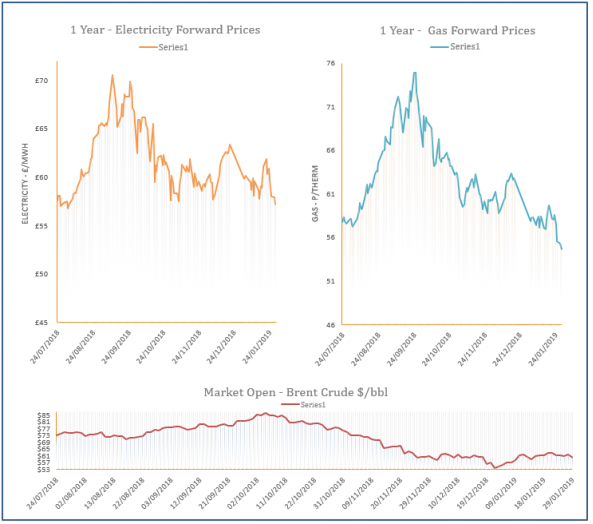
Energy Market Analysis – 29-01-2019
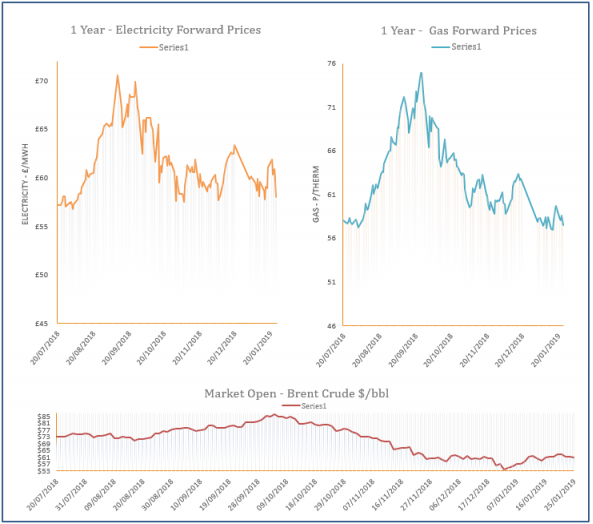
29th January 2019 | Posted by: Daniel Birkett | Market Analysis
Gas prices decreased on Monday as the overall energy complex was weak, with coal, carbon, power and oil markets all showing losses. An expected rise in temperatures further weighed on contracts at the front of the curve, in addition to healthy supply.
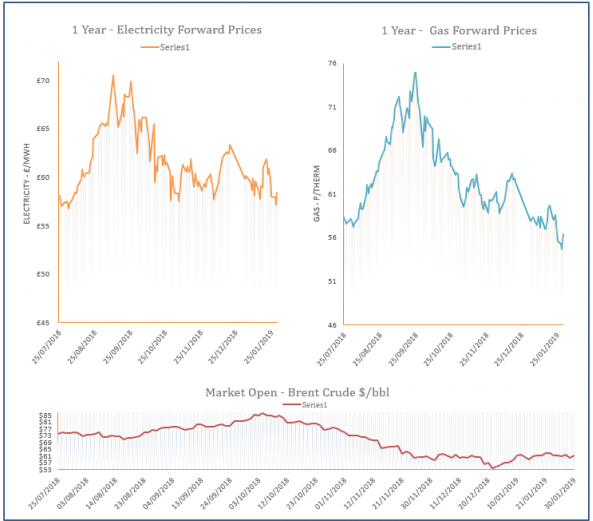
Energy Market Analysis – 28-01-2019
28th January 2019 | Posted by: Daniel Birkett | Market Analysis
Gas prices decreased on Friday as supply levels were healthy, with strong flows into the continent from Norway and Russia. Dutch production and LNG send-outs were also comfortable, while weaker demand was expected over the weekend. However, a rise in coal and oil limited losses on the far-curve.
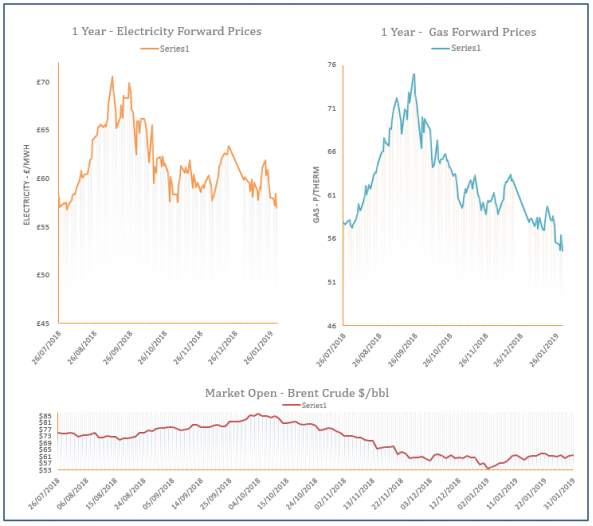
Energy Market Analysis – 25-01-2019
25th January 2019 | Posted by: Daniel Birkett | Market Analysis
Gas prices were pressured down by a long system and a weaker demand forecast, with milder weather expected over the weekend and next week. Another LNG delivery is also scheduled to dock in the UK even though storage is close to capacity.