


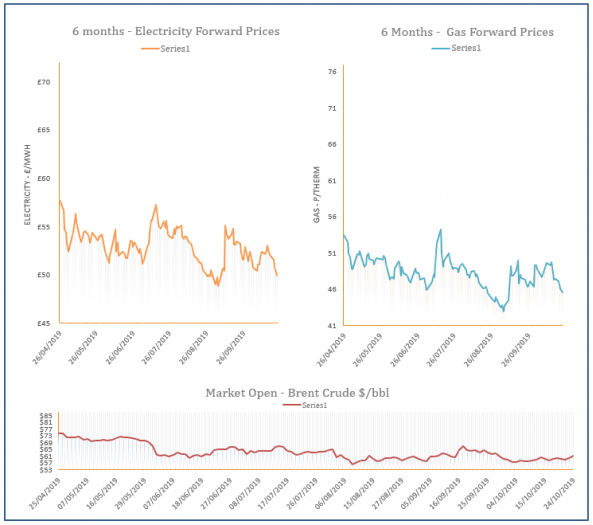
Energy Market Analysis – 24-10-2019
24th October 2019 | Posted by: Daniel Birkett | Market Analysis
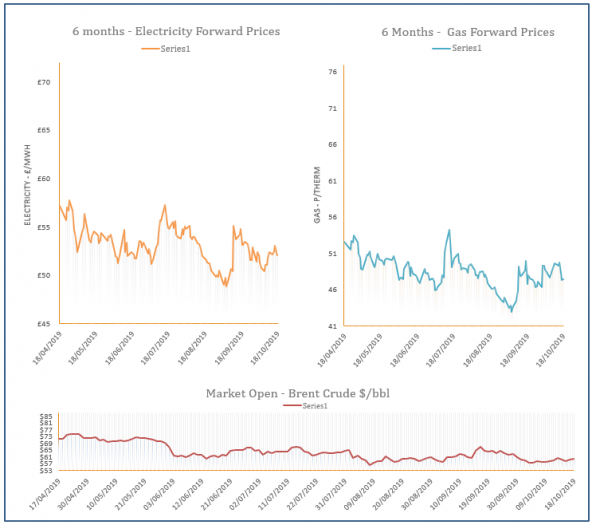
Gas prices moved down during Tuesday’s session with direction coming from a drop in coal, power and carbon markets. There is a cold weather outlook as we head towards the weekend but this has been offset by an expected rise in wind generation.
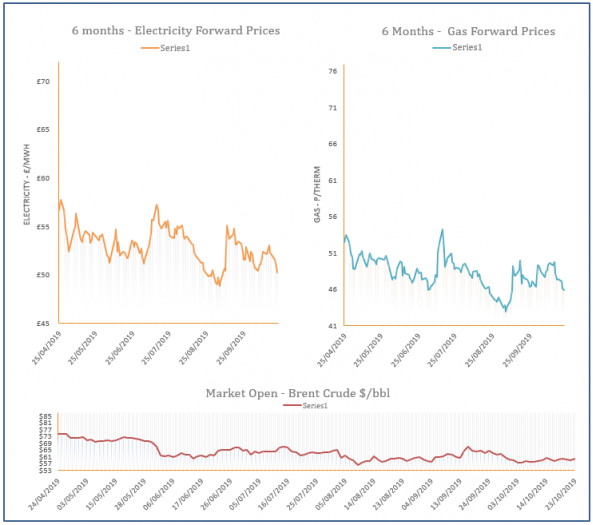
Energy Market Analysis – 23-10-2019
23rd October 2019 | Posted by: Daniel Birkett | Market Analysis
Changes along the gas curve were minimal yesterday despite a drop in coal and carbon, with oil the only market to strengthen. A colder weather outlook offered support to the near-curve but any gains were offset by healthy supply levels.
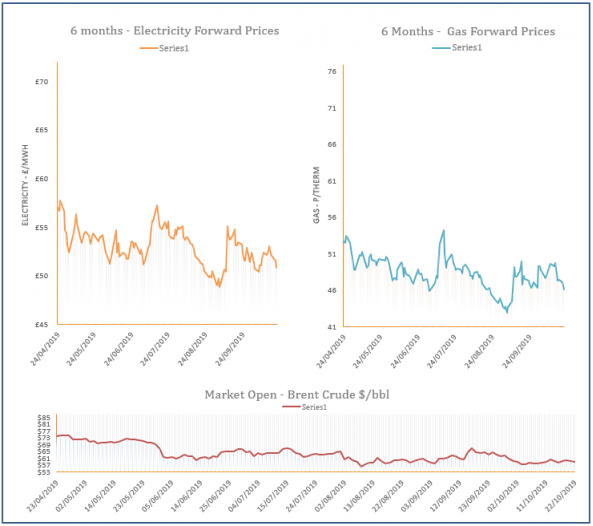
Energy Market Analysis – 22-10-2019
22nd October 2019 | Posted by: Daniel Birkett | Market Analysis
Gas contracts shed from their price yesterday with the prompt taking direction from lower demand and healthy supply. Meanwhile, prices further along the curve were pressured down by a falling oil market.
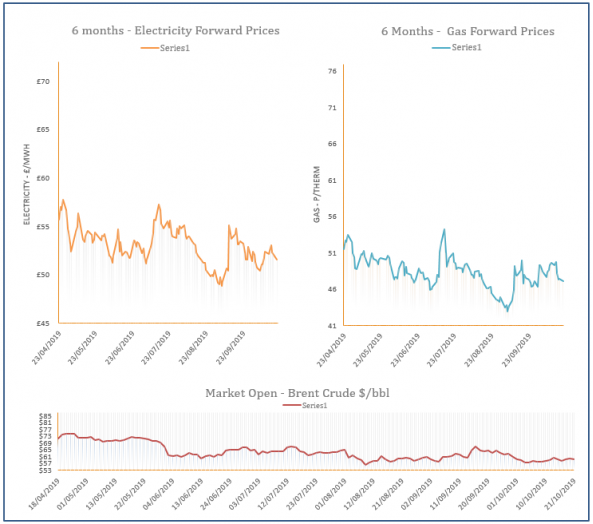
Energy Market Analysis – 21-10-2019
21st October 2019 | Posted by: Daniel Birkett | Market Analysis
Gas prices moved down at the end of last week, with the exception of the prompt which found support from a tighter system and increased power demand. The rest of the curve was pressured down by a drop in oil and carbon, while coal was unchanged.
Energy Market Analysis – 18-10-2019
18th October 2019 | Posted by: Daniel Birkett | Market Analysis
Gas prices traded down during Thursday’s session despite a rise in oil prices. Coal and carbon markets moved down, creating mixed sentiment, while a healthy supply outlook helped to weigh on the near-curve.