


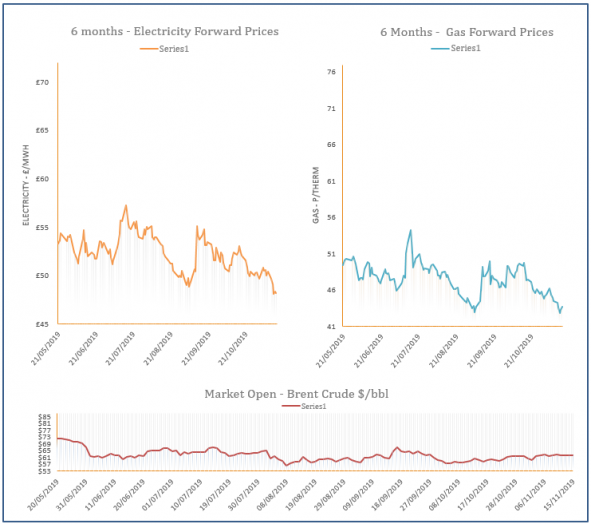
Energy Market Analysis – 15-11-2019
15th November 2019 | Posted by: Daniel Birkett | Market Analysis
Gas prices moved higher yesterday afternoon, following an increase in coal and ignoring a slight drop in oil and carbon. The short-term weather outlook is rather mild for this time of year which should limit residential demand, while supply levels are very healthy, capping gains at the front of the curve.
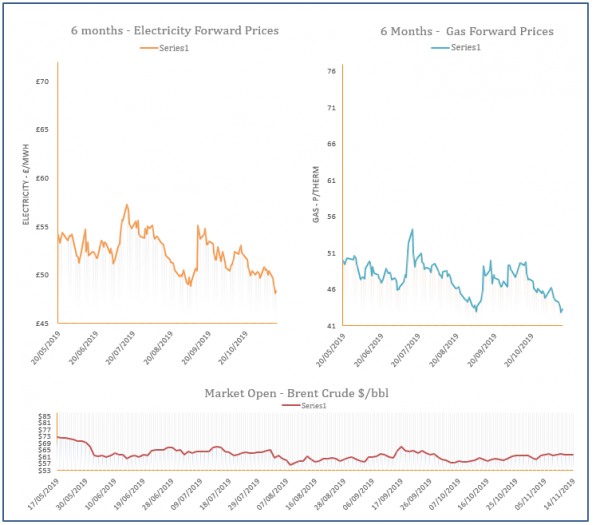
Energy Market Analysis – 14-11-2019
14th November 2019 | Posted by: Daniel Birkett | Market Analysis
Gas prices were slightly bearish throughout Wednesday’s session with most of the losses displayed on the far-curve, while spot prices were largely stable. An upward revision in temperatures restricted bullish movement on the near-curve, despite a rebound in oil, coal and carbon.
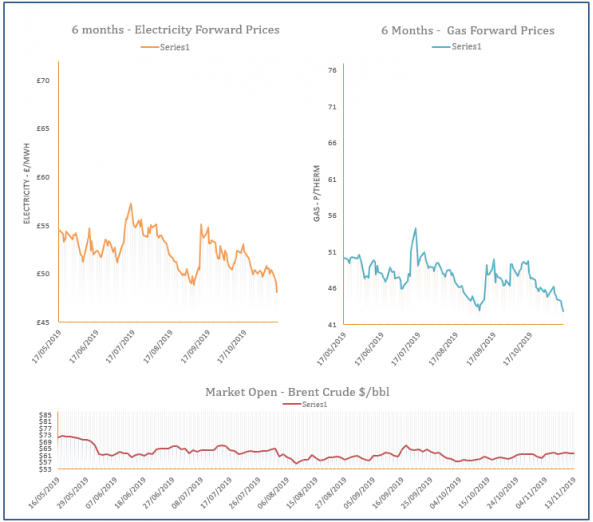
Energy Market Analysis – 13-11-2019
13th November 2019 | Posted by: Daniel Birkett | Market Analysis
Gas prices continued to display a bearish trend during Tuesday’s session with high flows from Norway and record high LNG send-outs resulting in oversupply. Overall energy markets also weakened, applying further downward pressure to the far-curve.

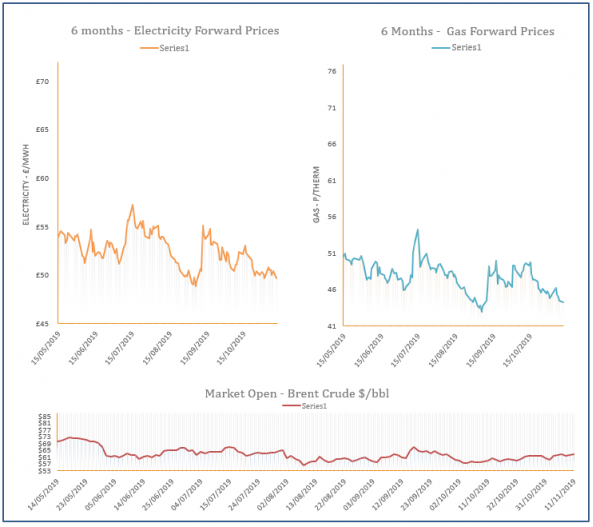
Energy Market Analysis – 12-11-2019
12th November 2019 | Posted by: Daniel Birkett | Market Analysis
Following a slightly bullish open, gas prices eased down by the end of the session, tracking movement across overall energy markets. Healthy supply levels also coincided with a drop in demand, resulting in a long system which added to the bearish pressure.
Energy Market Analysis – 11-11-2019
11th November 2019 | Posted by: Daniel Birkett | Market Analysis
Far-curve gas prices moved down during Friday’s session and ended the week with an overall loss; a drop in coal and carbon helped towards the downward trend. However, spot prices were largely bullish due to the colder weather forecast.