


Energy Market Analysis – 29-03-2019
29th March 2019 | Posted by: Daniel Birkett | Market Analysis
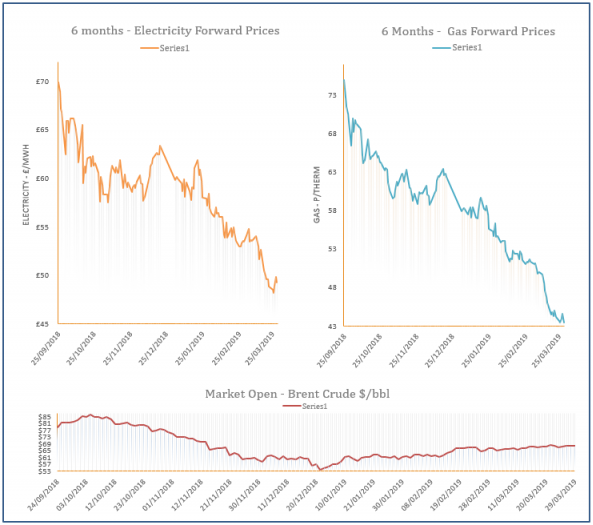
Gas prices moved down on Thursday ahead of the expiry of several contracts today. A healthy LNG outlook, a mild weather forecast and a drop in coal prices helped towards bearish sentiment across the curve.
Energy Market Analysis – 28-03-2019
28th March 2019 | Posted by: Daniel Birkett | Market Analysis
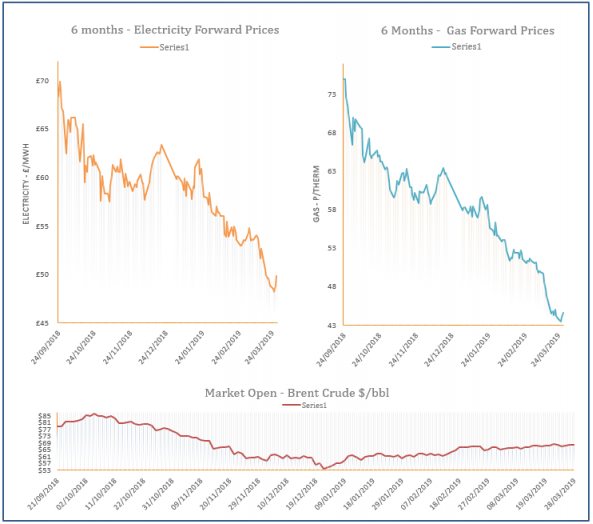
Gas prices moved higher yesterday as the supply/ demand outlook for the coming days is tighter and cooler temperatures are forecast for next week. The gas curve ignored weakening coal and oil markets and movement was dictated by the shortfall in supply.
Energy Market Analysis – 27-03-2019
27th March 2019 | Posted by: Daniel Birkett | Market Analysis
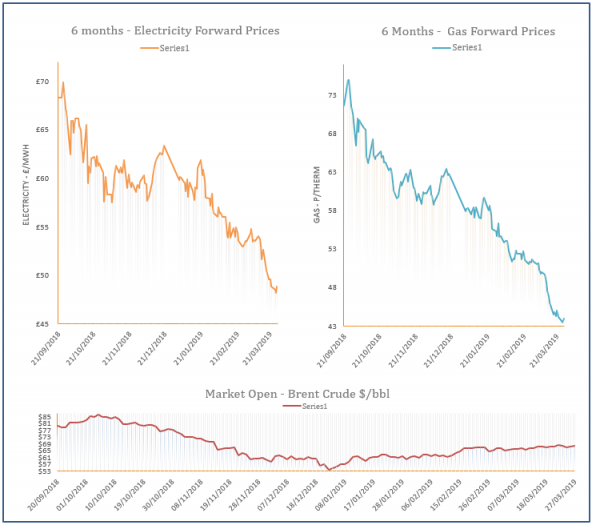
Gas prices moved higher yesterday afternoon following a rebound on coal and carbon markets, while oil prices also strengthened. Temperatures for the start of April were also revised down and a slight rise in demand was expected today.
Energy Market Analysis – 26-03-2019
26th March 2019 | Posted by: Daniel Birkett | Market Analysis
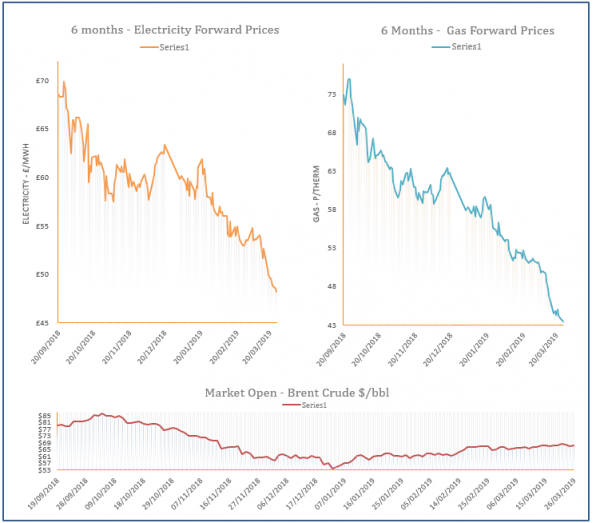
Near-curve gas prices traded down during Monday’s session as the system was oversupplied thanks to comfortable supply and weaker demand. Contracts at the back of the curve were slightly more resilient with resistance provided by a rebound in coal and oil.
Energy Market Analysis – 25-03-2019
25th March 2019 | Posted by: Daniel Birkett | Market Analysis
Gas prices continued to move down on Friday on the back of strong supply levels and weaker demand. Meanwhile, coal and oil prices moved down on a bearish day for commodity markets which applied further downward pressure on the far-curve.