


Energy Market Analysis – 05-04-2019
5th April 2019 | Posted by: Daniel Birkett | Market Analysis
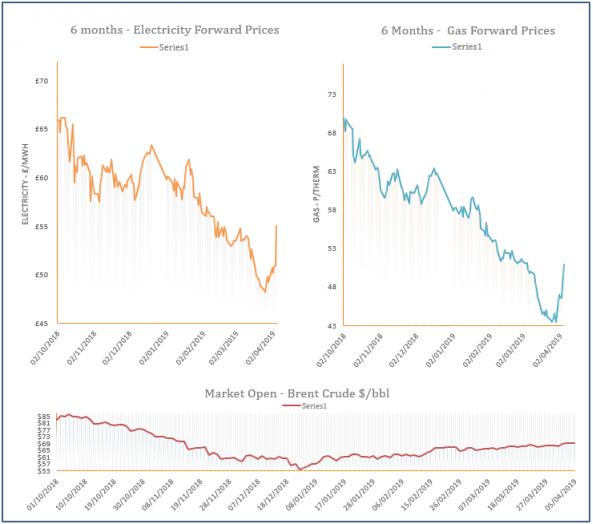
Gas prices initially moved down at the start of the session but quickly rebounded, ending the day at a premium. A cooler weather outlook helped to support the prompt, while the far-curve found support from bullish coal and oil.
Energy Market Analysis – 04-04-2019
4th April 2019 | Posted by: Daniel Birkett | Market Analysis
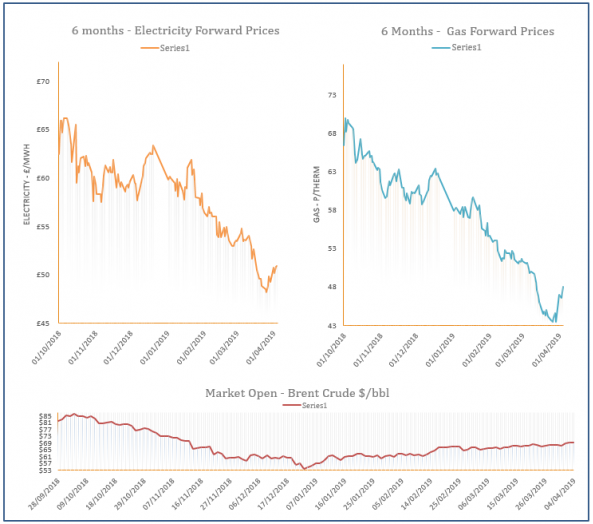
Gas prices inched higher in the afternoon, with support provided by increases on power and carbon markets, while Brent also remained bullish. However, a milder weather outlook and a rise in LNG send-outs helped to limit upward movement at the front of the curve.
Energy Market Analysis – 03-04-2019
3rd April 2019 | Posted by: Daniel Birkett | Market Analysis
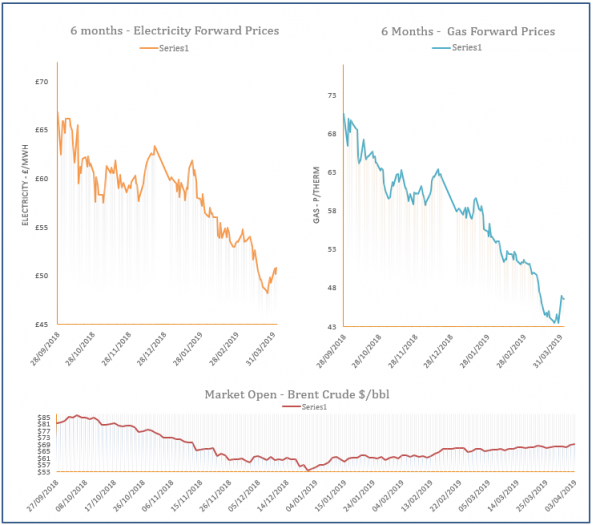
Near-curve gas prices decreased on Tuesday with the help of an oversupplied system and a strong rise in LNG send-outs, following fresh deliveries to the UK. Coal prices also weakened which helped to weigh on contracts further along the curve.
Energy Market Analysis – 02-04-2019
2nd April 2019 | Posted by: Daniel Birkett | Market Analysis
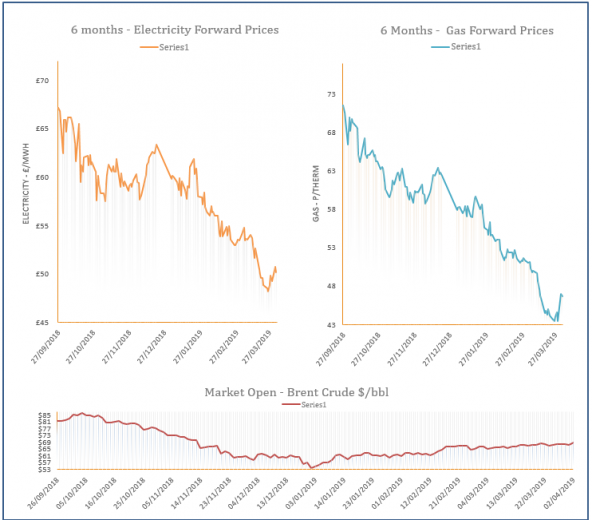
The first day of summer trading saw numerous losses on the gas curve yesterday, with an oversupplied system weighing on spot prices. A healthy LNG outlook provided additional bearish pressure, although a rise in oil markets limited downward movement further out.
Energy Market Analysis – 01-04-2019
1st April 2019 | Posted by: Daniel Birkett | Market Analysis
The April, Q-2 and Summer-19 contracts traded down before their expiry on Friday. The rest of the curve also decreased with direction coming from weaker coal and carbon markets, although the larger losses were seen on the power curve.