


Energy Market Analysis - 16-05-2019
16th May 2019 | Market Analysis
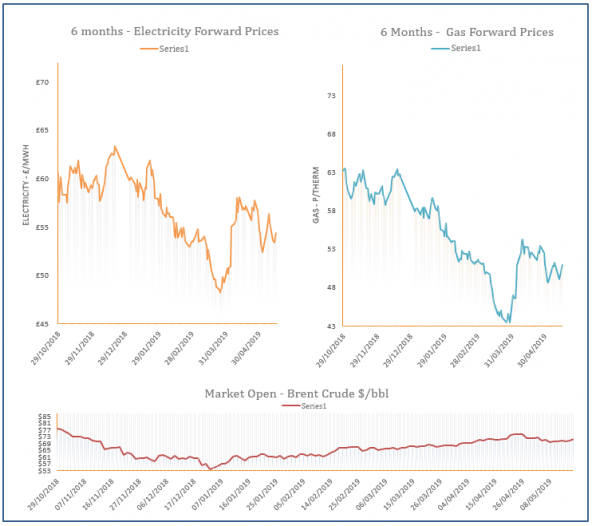
An oversupplied system pressured the prompt yesterday, despite an up in demand from the previous day. There were late gains on the far curve as strength in the Carbon and Oil markets supported the curve.
Energy Market Analysis - 15-05-2019
15th May 2019 | Posted by: Natalie Ormrod | Market Analysis
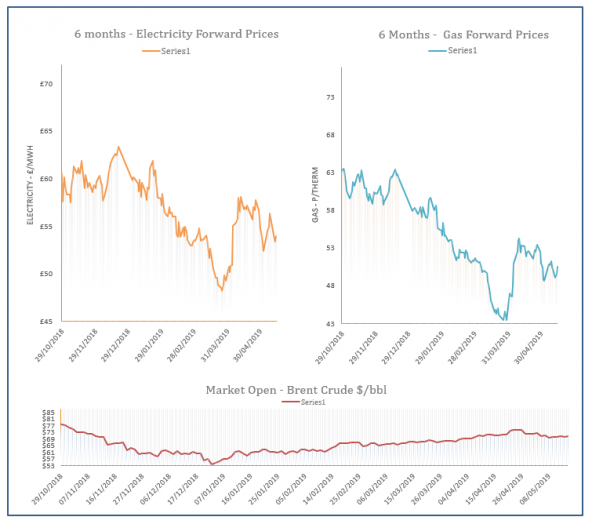
Gas prices mostly rebounded on the curve yesterday, which was oversupplied throughout the day despite an increase in exports to the continent through the Interconnector pipeline. The gains mirrored increases in oil, coal and carbon prices.
Energy Market Analysis - 14-05-2019
14th May 2019 | Market Analysis
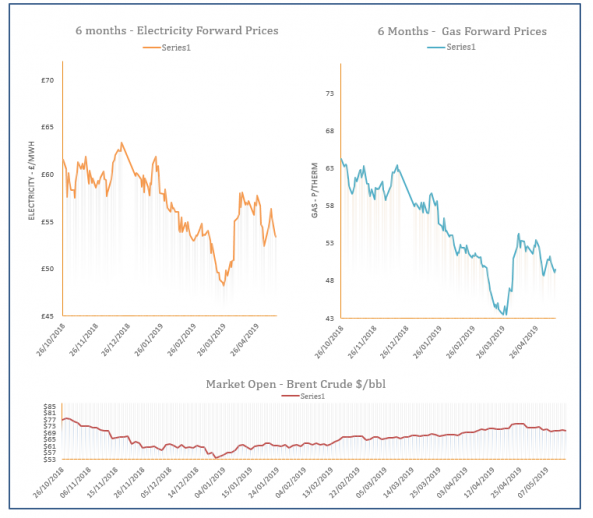
Crude oil contracts on Monday continued to trade lower, driven by lower demand caused by milder than expected weather. This combined with a healthy supply outlook as a further six LNG vessels are due to arrive before the end of May, provided a bearish outlook as gas markets closed yesterday.
Energy Market Analysis - 13-05-2019
13th May 2019 | Posted by: Lawrence Carson | Market Analysis
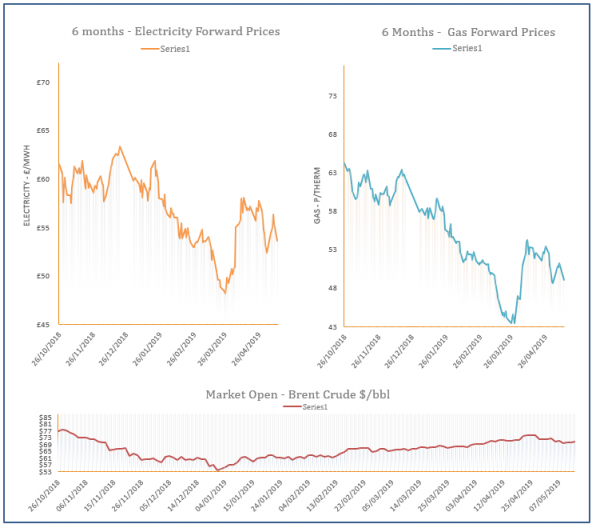
After a volatile week, gas prices fell on Friday. Rising temperatures and a change in the supply/demand balance were the reasons for the downward correction, leaving the gas system oversupplied.

Energy Market Analysis - 10-05-2019
10th May 2019 | Market Analysis
The longer dated contracts traded lower yesterday, this is following a weakening of the carbon market which began reversing its session-on-session gains. Further downside was added as the Cal 20 coal contract softened over the duration of the day.