


Energy Market Analysis –10-06-2019
10th June 2019 | Posted by: Daniel Birkett | Market Analysis
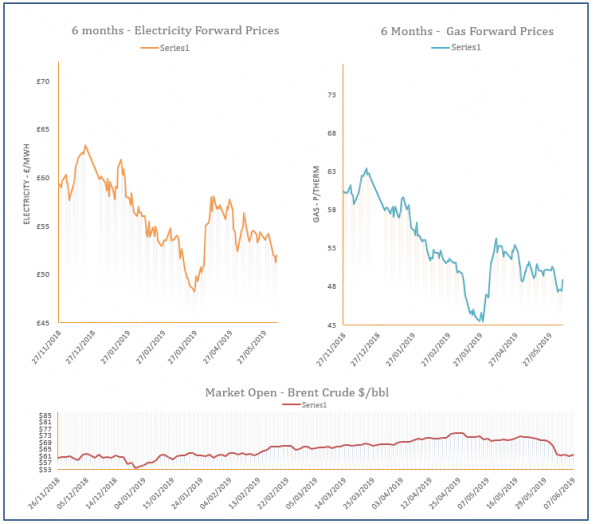
Gas prices were on the rise during Friday’s session due to an undersupplied system. A drop in wind generation increased gas-fired power demand, while LNG send-outs weakened, sending the system short. Meanwhile, far-curve prices found support from a bullish oil market as Russian look set to extend production cuts.
Energy Market Analysis –07-06-2019
7th June 2019 | Posted by: Daniel Birkett | Market Analysis
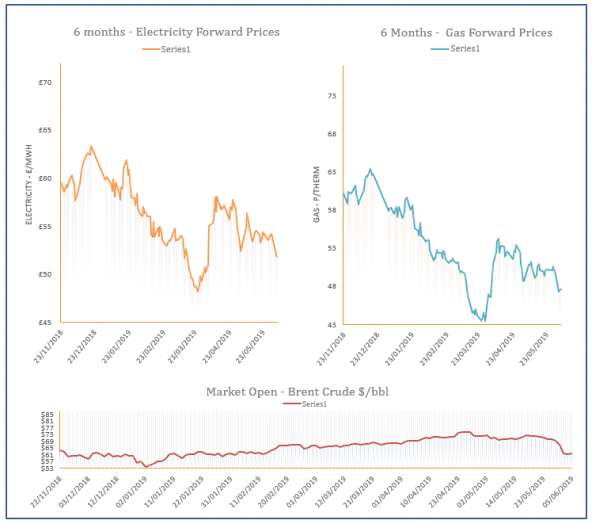
Gas prices displayed little movement at the opening of Thursday’s session but moved down over the course of the day. Healthy supply levels helped to weigh on prices at the front of the curve, while movement further out was less significant with bullish resistance provided by a rise in coal and oil.

Energy Market Analysis –06-06-2019
6th June 2019 | Posted by: Daniel Birkett | Market Analysis
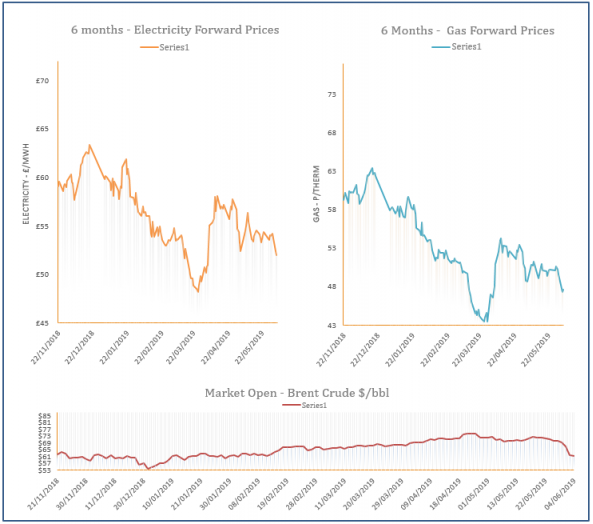
Gas prices decreased during Wednesday’s session due to comfortable supply; storage levels are extremely healthy and the LNG outlook is strong. Weaker coal, carbon and oil markets also applied downward pressure to contracts on the far-curve.
Energy Market Analysis - 05-06-2019
5th June 2019 | Posted by: Natalie Ormrod | Market Analysis
Gas prices rebounded yesterday, driven by a move on spot prices. Longer dated contracts saw little movement despite gains in coal, Brent oil and carbon.
Energy Market Analysis –04-06-2019
4th June 2019 | Posted by: Daniel Birkett | Market Analysis
Gas prices traded down during Monday’s session as global markets weakened due to the aggressive economic tactics currently being deployed by the US. Oil displayed a strong loss, while coal also moved down. Meanwhile, high storage levels and healthy LNG send-outs provided additional bearish pressure at the front of the curve.