


Energy Market Analysis – 23-09-2019
23rd September 2019 | Posted by: Daniel Birkett | Market Analysis
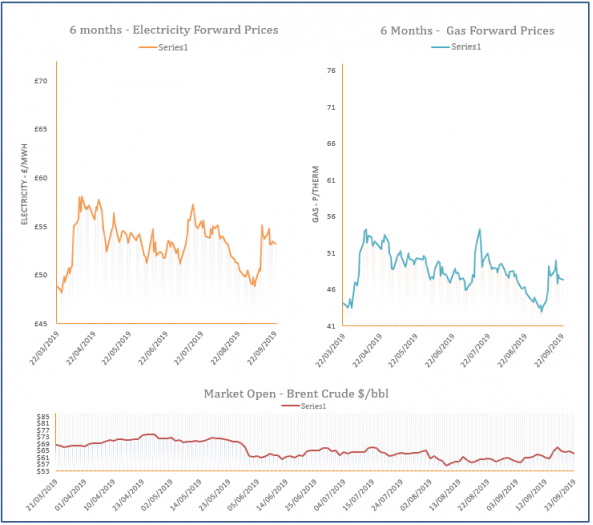
Gas contracts climbed higher during Friday’s session, following rising coal and carbon markets, while oil stabilised. A weaker supply/ demand outlook for the start of this week offered additional support to the near-curve.
Energy Market Analysis – 20-09-2019
20th September 2019 | Posted by: Daniel Birkett | Market Analysis
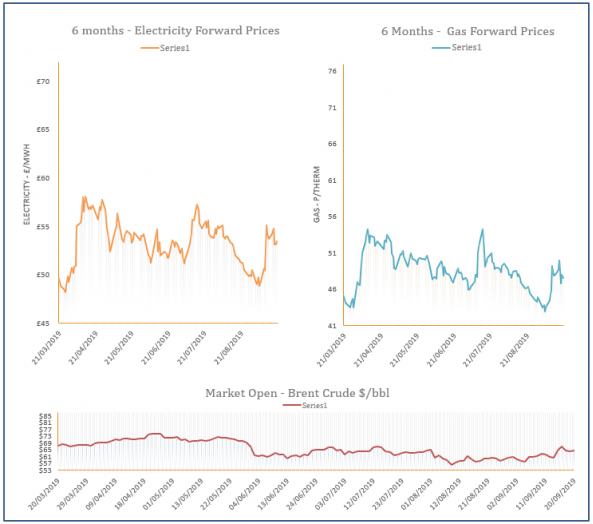
Gas prices were generally stable during Thursday’s session with an undersupplied system offset by a healthy LNG outlook and comfortable storage levels. Contracts largely ignored increases on coal, oil and carbon markets and movement on the far-curve was minimal.

Energy Market Analysis – 19-09-2019
19th September 2019 | Posted by: Daniel Birkett | Market Analysis
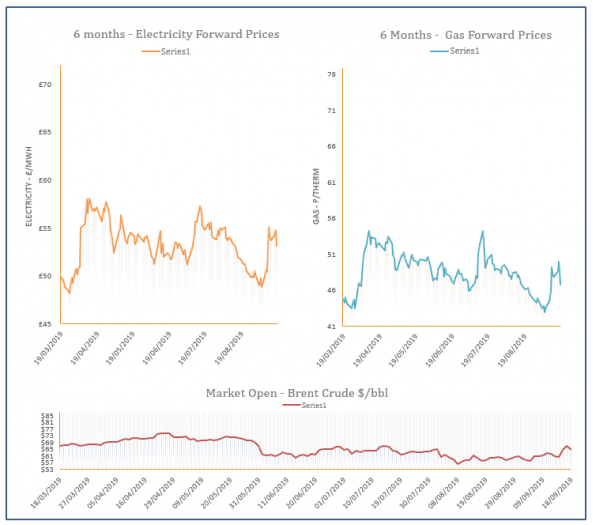
Gas prices moved down yesterday as the overall energy market weakened, helped by a more optimistic outlook for oil. LNG deliveries to Europe are also set to rise, helping to weigh on the near-curve, while Norwegian flows continued to improve.
Energy Market Analysis - 18-09-2019
18th September 2019 | Posted by: Natalie Ormrod | Market Analysis
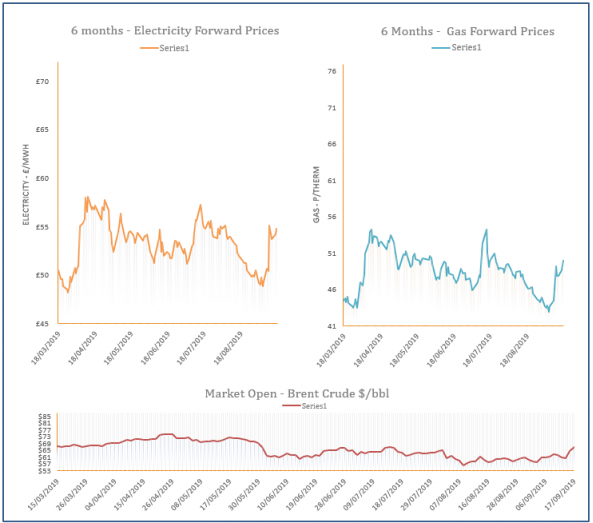
Gas contracts across the curve corrected yesterday, as Brent crude traded lower following the supply shock from the drone attacks in Saudi Arabia. Weaker coal and carbon markets also impacted on Gas prices.
Energy Market Analysis – 17-09-2019
17th September 2019 | Posted by: Daniel Birkett | Market Analysis
Gas prices climbed higher during Monday’s session, following strong gains on the oil market. An increase in coal also offered support to some gas contracts, with weak renewables also expected to result in higher gas-fired power demand, contributing to gains on the prompt.