Energy Market Analysis – 24-01-2020
24th January 2020 | Posted by: Daniel Birkett | Market Analysis
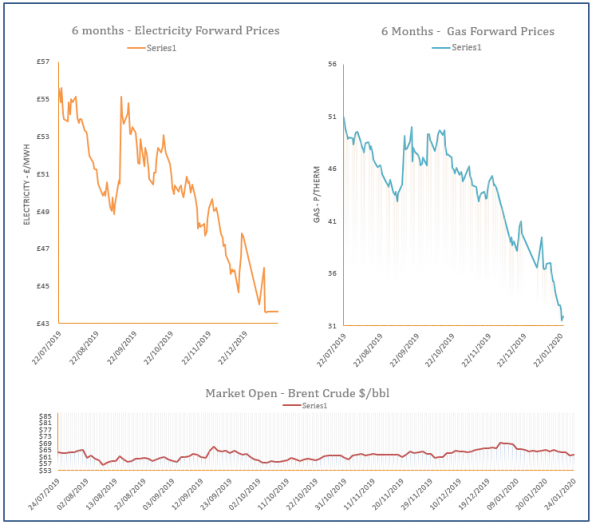
Near-curve gas prices moved down during Thursday’s session, while contracts further out were stable. Oil and carbon markets decreased, offsetting gains made by coal. In terms of supply, Norwegian and LNG flows improved, while demand fell, balancing the system.
Energy Market Analysis – 23-01-2020
23rd January 2020 | Posted by: Daniel Birkett | Market Analysis
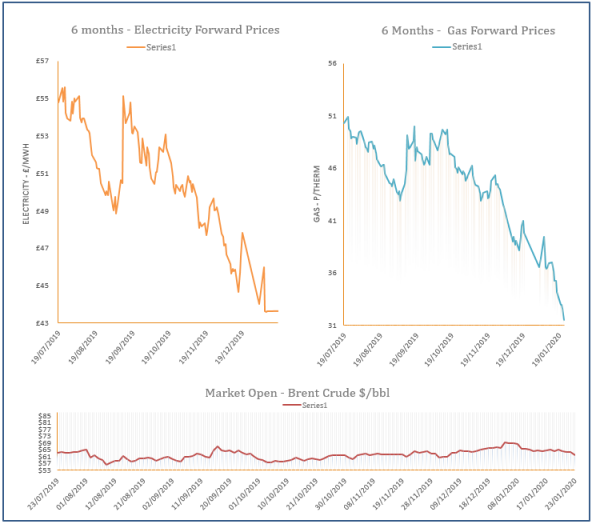
Gas prices displayed losses towards the end of Wednesday’s session, following a relatively stable opening. A drop in oil provided bearish pressure across the curve, while the system moved closer to balance due to weaker demand and improved Norwegian flows.
Energy Market Analysis – 22-01-2020
22nd January 2020 | Posted by: Daniel Birkett | Market Analysis
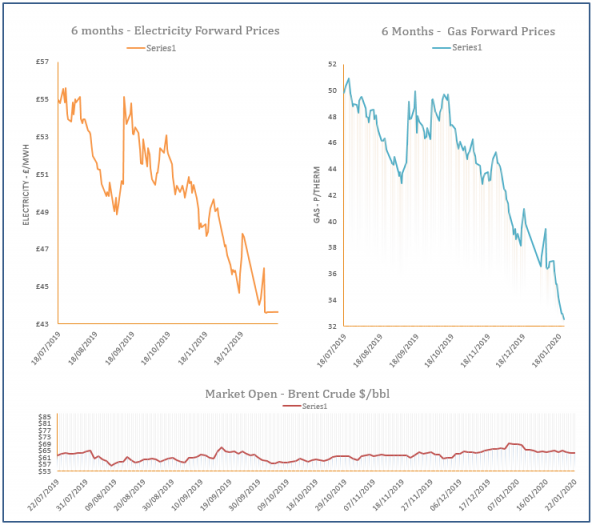
Gas prices moved higher during yesterday’s session as the system was under-supplied throughout the day. A rise in coal also offered support to the curve, while a decrease in carbon and oil had minimal impact.
Energy Market Analysis – 20-01-2020
20th January 2020 | Posted by: Daniel Birkett | Market Analysis
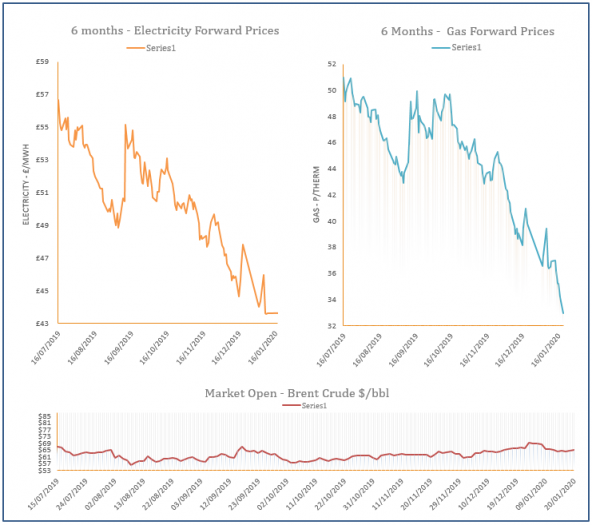
The majority of gas prices displayed a loss on Friday, ending a largely bearish week. A weaker wind generation outlook helped the prompt move higher but the rest of the curve was pressured down by a drop in coal and power contracts.
EU Carbon Market consultation launched
17th January 2020 | Posted by: Daniel Birkett | Market Analysis
A consultation has been proposed by the EU Commission with the aim of adjusting state aid rules for the EU Emissions Trading System (ETS) beyond 2021.


