


Energy Market Analysis – 23-10-2020
23rd October 2020 | Posted by: Daniel Birkett | Market Analysis
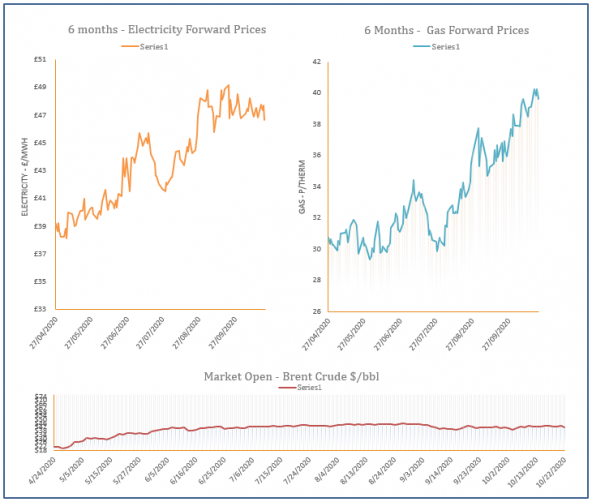
Gas prices increased towards the end of Thursday’s session, with the November contract displaying the most significant gains. A rebound in commodities and a tighter demand outlook for today offered support to the curve.
Energy Market Analysis – 22-10-2020
22nd October 2020 | Posted by: Daniel Birkett | Market Analysis
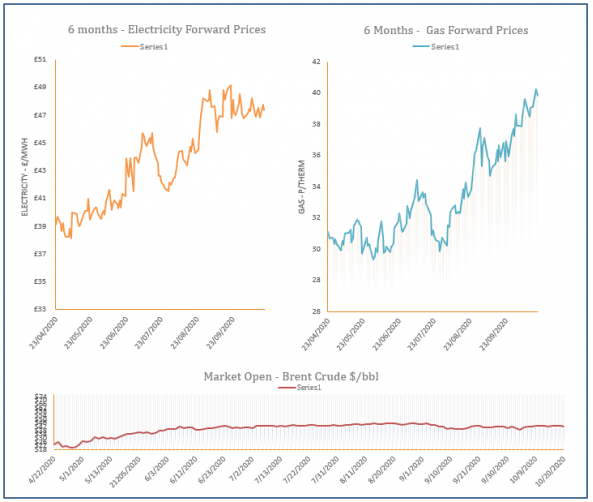
Gas prices were pushed lower by a strong rise in the Pound against the Euro yesterday, with Brexit negotiations set to recommence. The supply/ demand picture is set to remain healthy today which helped the prompt record a loss.

Energy Market Analysis – 21-10-2020
21st October 2020 | Posted by: Lawrence Carson | Market Analysis
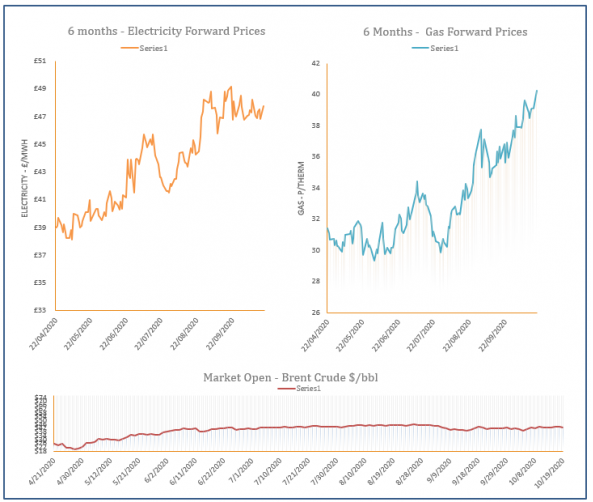
European spot gas prices were mixed again yesterday as fundamentals remained almost unchanged. On the curve, prices were up on all markets, still supported by concerns on US LNG output.
Energy Market Analysis – 20-10-2020
20th October 2020 | Posted by: Daniel Birkett | Market Analysis
Gas prices found some support yesterday from a longer-term view in regard to supply/ demand but an oversupplied system helped to weigh on the prompt. Further out, commodities offered little in the way of direction and any movement was minimal.
Energy Market Analysis – 19-10-2020
19th October 2020 | Posted by: Daniel Birkett | Market Analysis
Gas prices eased down at the end of last week, taking direction from an expected rise in temperatures and renewable availability. Oil displayed a small downward correction, with volatility expected this week in the build up to the US election.