


Energy Market Analysis – 09-10-2020
9th October 2020 | Posted by: Daniel Birkett | Market Analysis
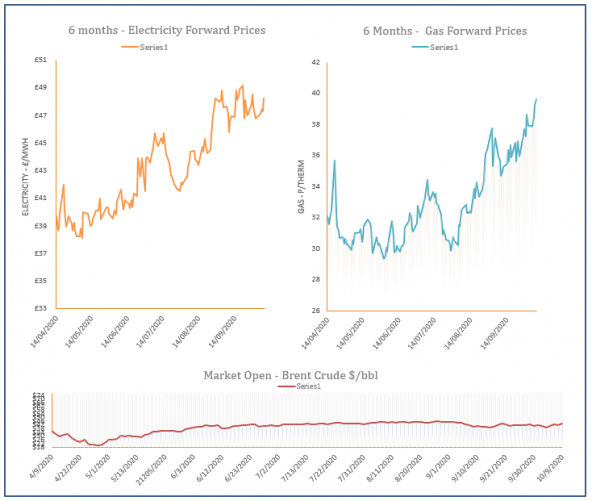
Gas prices were pushed higher by a rallying oil market, with expected strike action at Norwegian oil & gas facilities also offering support. Colder weather continued to lift demand but its impact was offset by healthy LNG send-outs.
Energy Market Analysis – 08-10-2020
8th October 2020 | Posted by: Daniel Birkett | Market Analysis
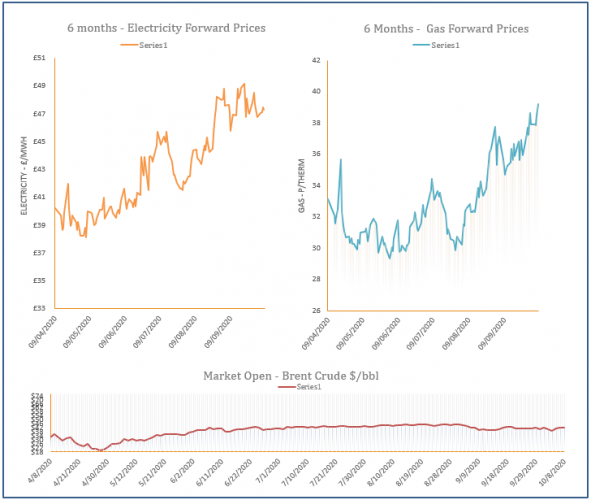
Gas prices climbed higher yesterday, with the prompt finding support from an expected drop in renewable levels tomorrow, lifting demand for gas-fired power. Oil prices retraced slightly but overall sentiment on the far-curve remained bullish.
Energy Market Analysis – 07-10-2020
7th October 2020 | Posted by: Daniel Birkett | Market Analysis
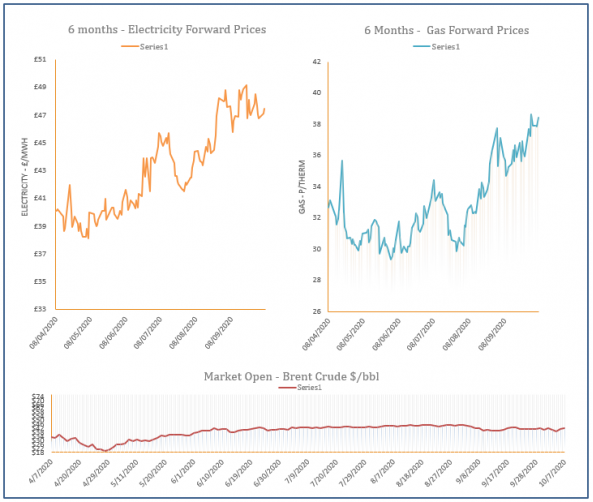
Gas prices were generally stable throughout Tuesday’s session, with an oversupplied system helping to weigh on prices at the front of the curve. A rise in oil offered support further along the curve but any movement was minimal.
Energy Market Analysis – 06-10-2020
6th October 2020 | Posted by: Daniel Birkett | Market Analysis
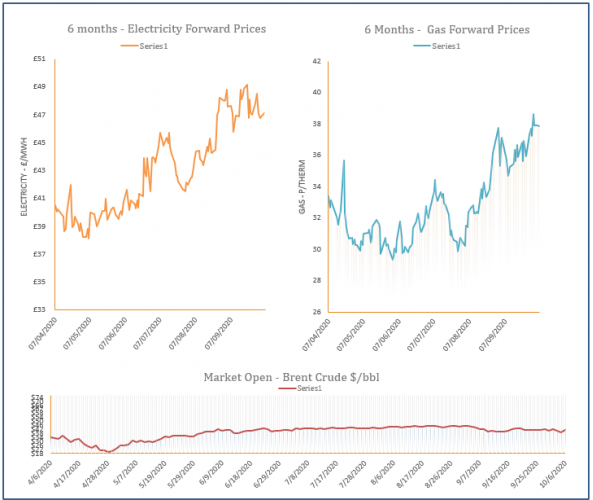
Gas prices recorded gains yesterday, taking direction from a rebound in oil and a recovery on the overall energy market. Carbon was the only market to trade sideways, while the front of the curve was pushed higher by an undersupplied system.
Energy Market Analysis – 05-10-2020
5th October 2020 | Posted by: Daniel Birkett | Market Analysis
Gas prices moved down on Friday, pressured down by a weakening oil markets which also transferred to carbon, coal and power contracts. Meanwhile, the prompt found support from a cooler weather and weak renewable power forecast for this week.