


Energy Market Analysis – 09-11-2020
9th November 2020 | Posted by: Daniel Birkett | Market Analysis
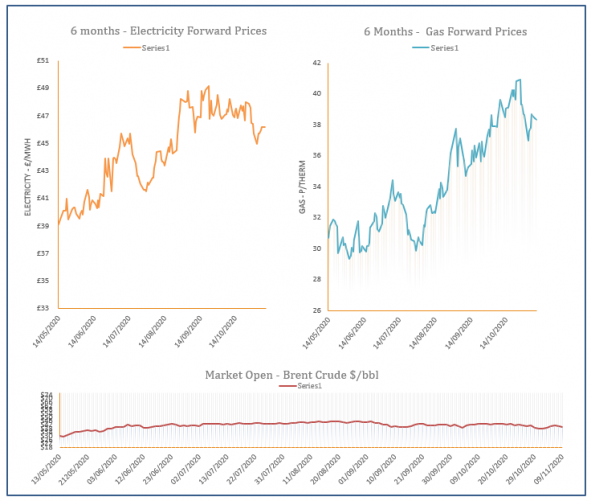
The forecast for this week pointed towards temperatures above the seasonal norm which contributed to some downward movement on the near curve on Friday. A weak renewable outlook lifted the prompt, while a drop in oil weighed on the far curve.
Energy Market Analysis – 06-11-2020
6th November 2020 | Posted by: Daniel Birkett | Market Analysis
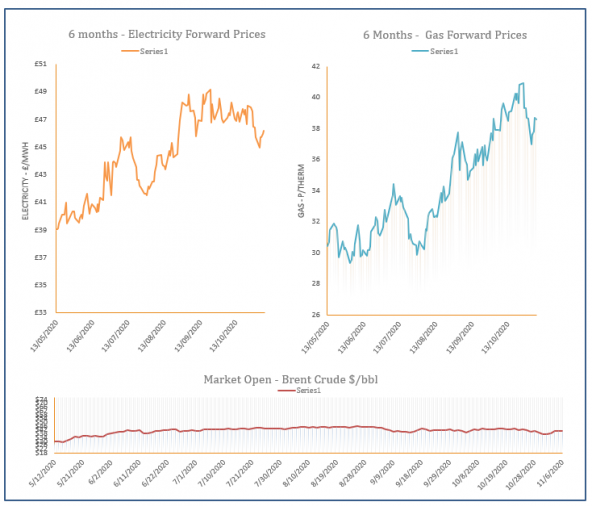
Oil prices dipped in the afternoon, resulting in some losses on the far curve. The front of the curve found support from a rise in demand, with colder temperatures and additional home working contributing to higher residential consumption.
Energy Market Analysis – 05-11-2020
5th November 2020 | Posted by: Daniel Birkett | Market Analysis
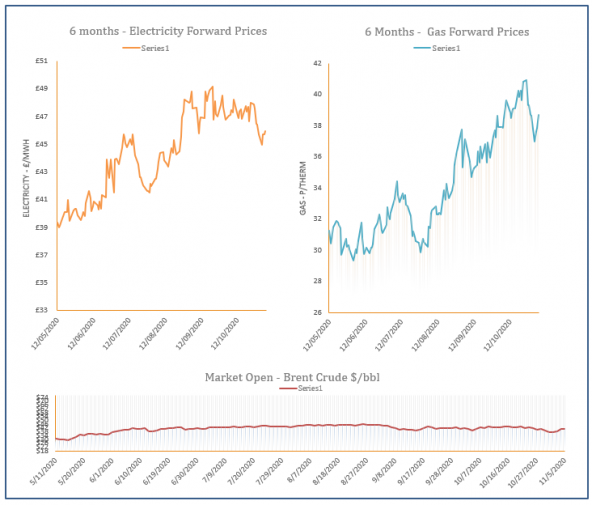
Despite an oversupplied system, gas prices traded higher due to an expected rise in demand as cold temperatures hit the UK, in addition to a low renewable generation outlook for today. Further out, a rise in oil was the main focus.

Energy Market Analysis – 04-11-2020
4th November 2020 | Posted by: Daniel Birkett | Market Analysis
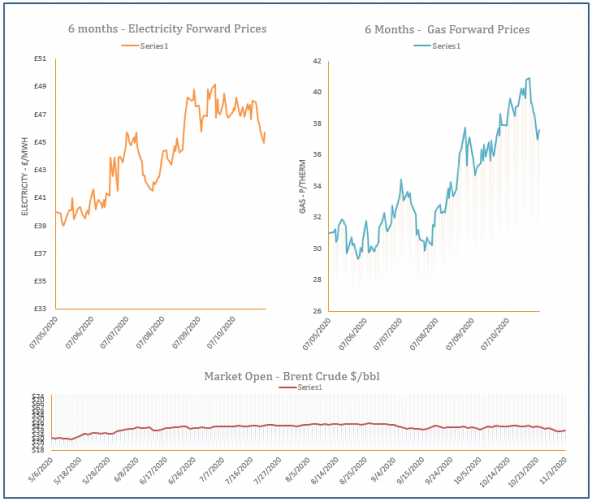
Gas prices increased during Tuesday’s session, taking direction from a colder weather outlook and increasing oil. Meanwhile, a weaker wind generation forecast helped the prompt add to its price.
Energy Market Analysis – 03-11-2020
3rd November 2020 | Posted by: Daniel Birkett | Market Analysis
The UK gas system was well supplied throughout Monday’s session due to lower gas-fired power demand, mild temperatures and strong flows. This contributed to losses on the near curve, although longer dated contracts found some support from a late rally by oil.