


Energy Market Analysis – 16-12-2020
16th December 2020 | Posted by: Daniel Birkett | Market Analysis
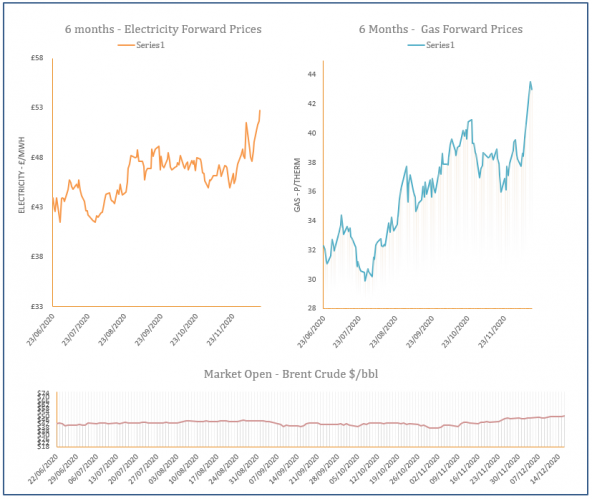
Gas prices increased yesterday on the back of expectations of tighter supply at the start of next year, although mild weather and improved renewables limited upward movement on the prompt.
Energy Market Analysis – 15-12-2020
15th December 2020 | Posted by: Daniel Birkett | Market Analysis
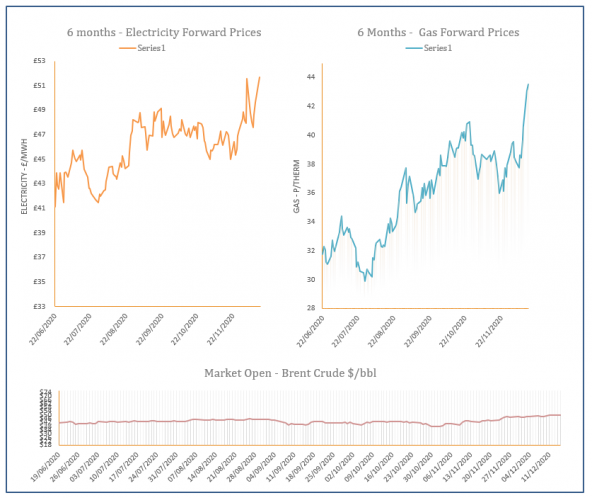
Demand levels were well below the seasonal norm yesterday and the gas system was comfortably supplied, however, maintenance in the North Sea has impacted storage injections and increased supply risk for the start of next year; overall movement was bullish as a result.
Energy Market Analysis – 14-12-2020
14th December 2020 | Posted by: Daniel Birkett | Market Analysis
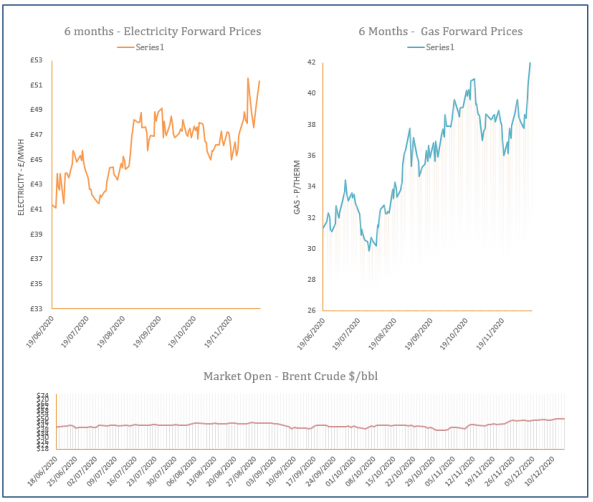
Planned maintenance in Norway impacted flows into the UK on Friday, reducing storage injections and creating additional supply risk for Q1-21, helping towards gains across the near curve. Further out, prices were pushed higher by stronger coal, carbon and oil.
Energy Market Analysis – 11-12-2020
11th December 2020 | Posted by: Daniel Birkett | Market Analysis
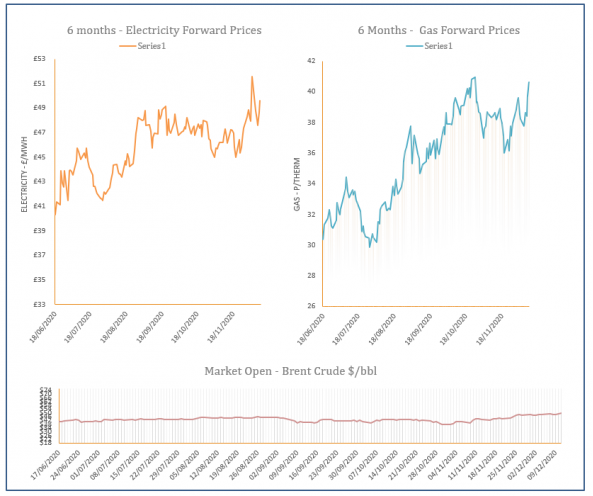
Gas prices increased strongly yesterday afternoon, in particular the Q1-21 contract which found support from a tighter supply outlook. Contracts further along the curve were also pushed higher by stronger coal and oil markets.
Energy Market Analysis – 10-12-2020
10th December 2020 | Posted by: Daniel Birkett | Market Analysis
Planned maintenance in Norway was expected to limit flows into the UK today, resulting in some upward movement on the near curve, although this was offset by the forecast of mild and windier weather. Contracts further out displayed minor increases, following the overall energy complex.