


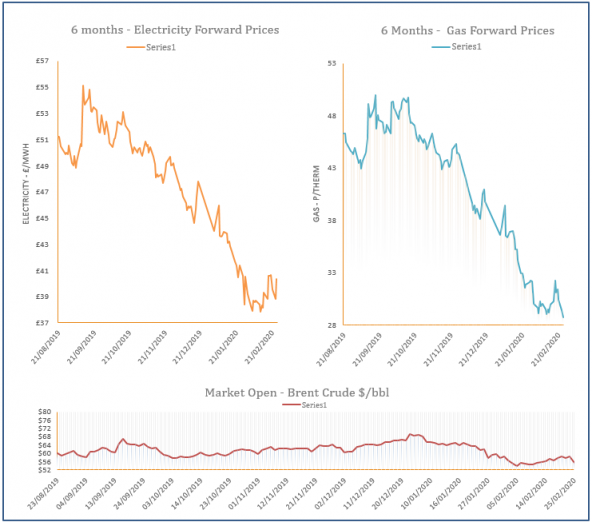
Energy Market Analysis - 28-02-2020
28th February 2020 | Posted by: Natalie Ormrod | Market Analysis
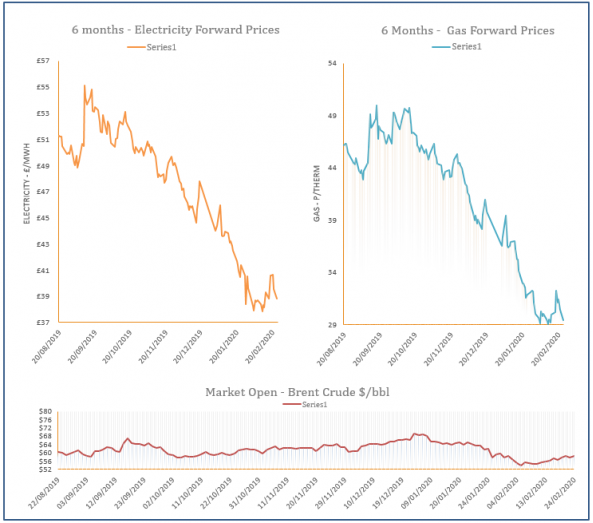
Gas prices continued to weaken yesterday, under pressure from falling coal, oil, power and carbon prices. Disruption to the LNG deliveries helped to push near curve prices higher, however selling pressure and weak oil and carbon prices saw the curve move lower.
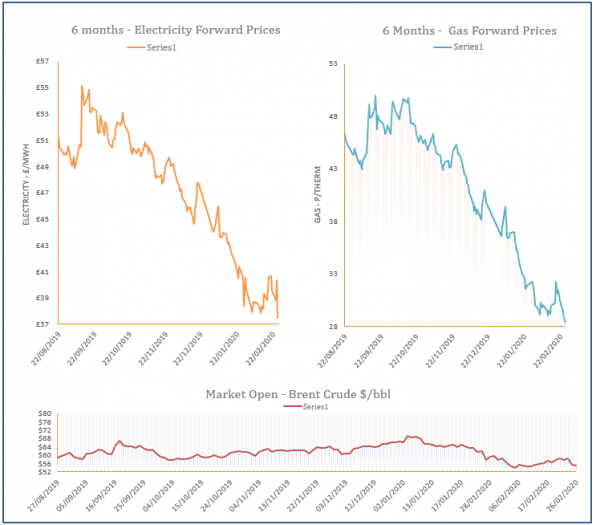
Energy Market Analysis – 27-02-2020
27th February 2020 | Posted by: Daniel Birkett | Market Analysis
Gas prices recovered slightly on Wednesday following new lows at the start of the session. An undersupplied system offered some support to the near-curve, as an expected drop in renewables today was likely to lift demand further.
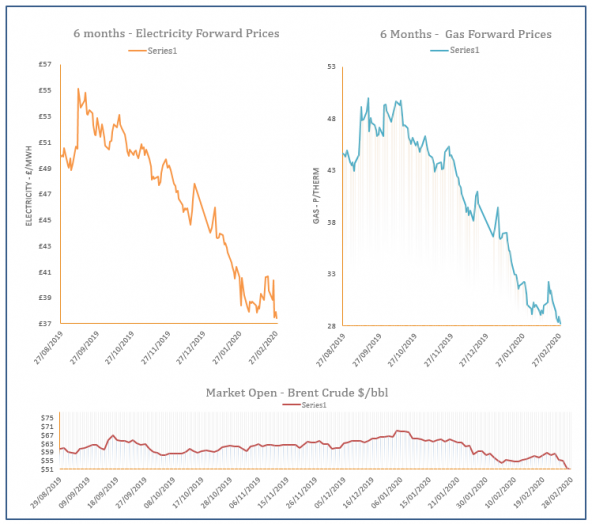
Energy Market Analysis – 26-02-2020
26th February 2020 | Posted by: Daniel Birkett | Market Analysis
Gas prices continued to move down yesterday with falling oil markets continuing to dictate the overall energy complex. Colder weather lifted heating demand but the system moved closer to balance as gas-fired power demand remained low due to ample renewable availability.
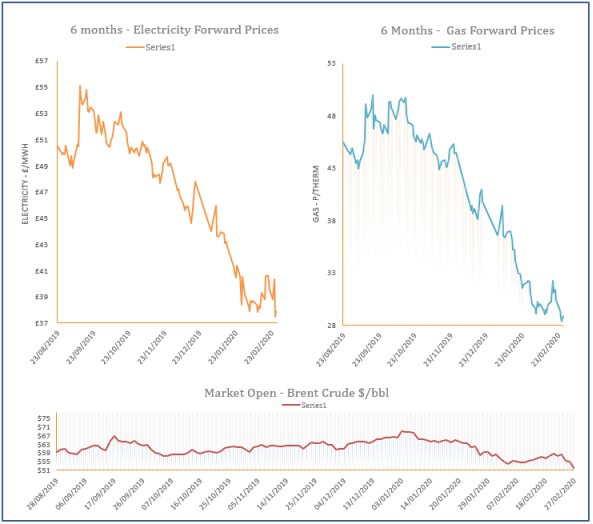
Energy Market Analysis – 25-02-2020
25th February 2020 | Posted by: Daniel Birkett | Market Analysis
Gas prices decreased during Monday’ session, following falling oil markets as global economies took a hit due to fresh cases of the Coronavirus. The UK gas system was also undersupplied, offering additional support to the prompt and near-curve.
Energy Market Analysis – 24-02-2020
24th February 2020 | Posted by: Daniel Birkett | Market Analysis
Gas contracts moved down during Friday’s session, finding direction from weaker oil markets and an oversupplied system. Strong winds prevented the arrival of new LNG send-outs but also reduced demand, while flows were almost unchanged.