


Energy Market Analysis – 21-02-2020
21st February 2020 | Posted by: Daniel Birkett | Market Analysis
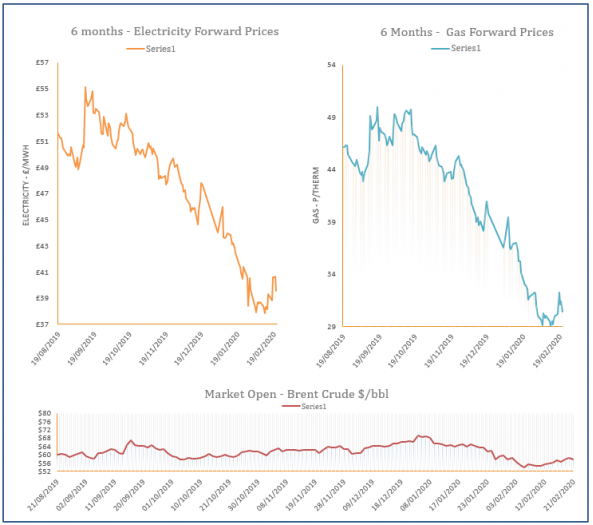
Gas prices moved down yesterday, following coal and power markets, with a healthier supply/ demand outlook dictating UK markets. Prices found some support in the afternoon which curbed the losses but the overall sentiment remained bearish.
Energy Market Analysis – 20-02-2020
20th February 2020 | Posted by: Daniel Birkett | Market Analysis
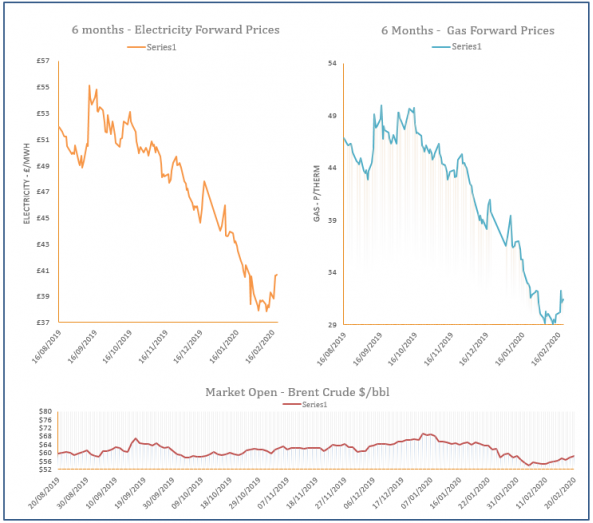
Gas prices initially opened higher yesterday but moved down as the session progressed and ended the day practically unchanged. Oil and carbon markets offered support, while a drop in LNG send-outs resulted in a short system.

Energy Market Analysis – 19-02-2020
19th February 2020 | Posted by: Lawrence Carson | Market Analysis
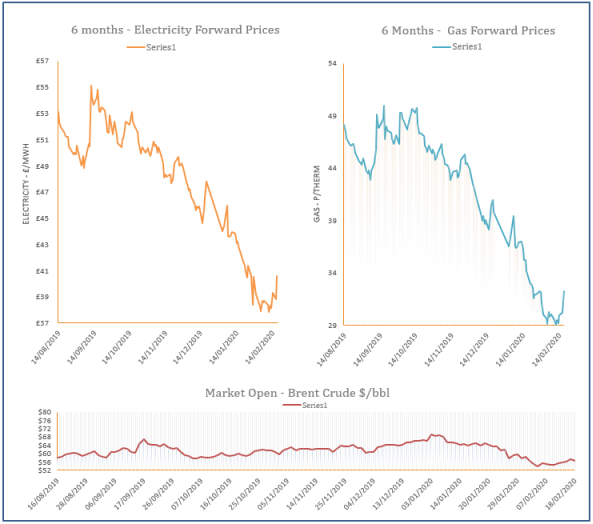
Difficulty unloading cargo in stormy weather at UK import terminals meant a further downward adjustment in LNG send outs, keeping spot prices in strong territory. Some contracts were overbought and gas fundamentals were largely bearish across Europe, meaning curve prices corrected downwards.
Energy Market Analysis – 18-02-2020
18th February 2020 | Posted by: Daniel Birkett | Market Analysis
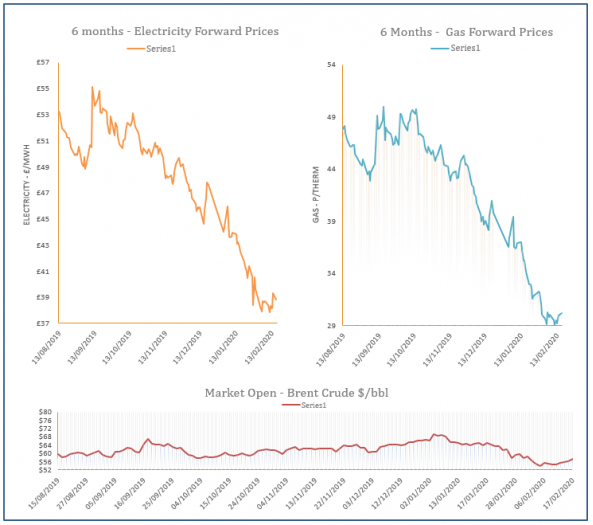
Gas prices displayed strong gains across the board yesterday, however, support was largely technical as traders tried to offload their short positions. Supply/ demand fundamentals were unchanged, while the broader energy complex only showed marginal changes.
Energy Market Analysis – 17-02-2020
17th February 2020 | Posted by: Daniel Birkett | Market Analysis
Gas prices moved higher during Friday’s session with the larger gains displayed towards the back of the curve. A recovery on oil markets offered support to the far-curve, while a milder and windy weather forecast for the second half of the month helped to limit upward movement on the near-curve.