


Energy Market Analysis – 31-07-2020
31st July 2020 | Posted by: Daniel Birkett | Market Analysis
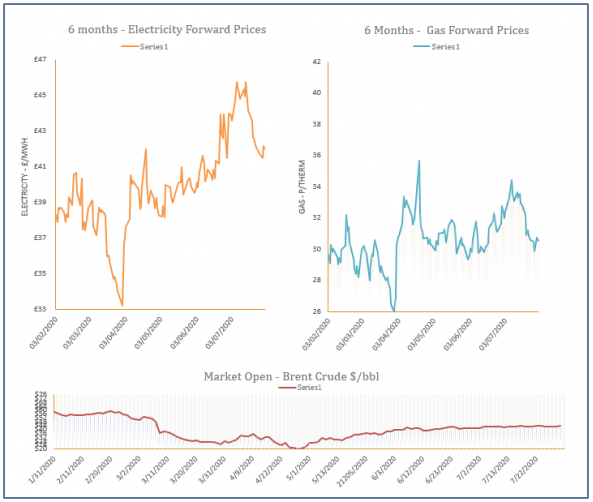
Gas prices stabilised in the afternoon and displayed losses by the session’s close. Equity markets dropped off, along with oil and coal as EU & US economies showed weak data. Power and Carbon allowance contracts also closed lower.

Energy Market Analysis – 30-07-2020
30th July 2020 | Posted by: Daniel Birkett | Market Analysis
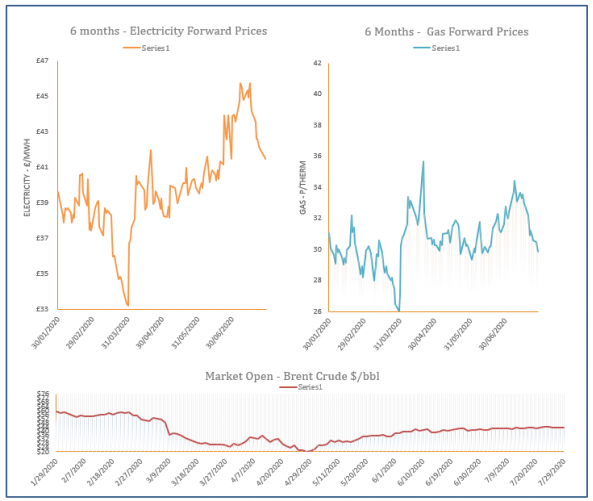
Gas prices rose again yesterday, with support provided by stronger coal and oil. Power and carbon also strengthened, offering additional support, while a drop in renewable power lifted gas demand and helped the prompt move higher.
Energy Market Analysis – 29-07-2020
29th July 2020 | Posted by: Daniel Birkett | Market Analysis
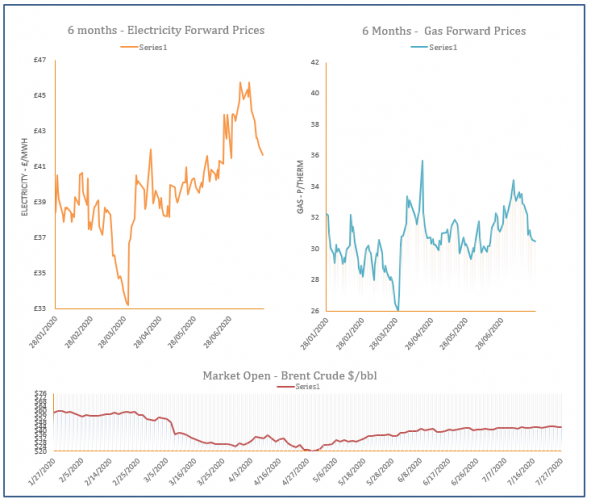
Gas prices moved slightly higher yesterday, with near curve contracts finding support from a tighter supply/ demand outlook. Coal and carbon also increased, helping towards small increases further out.

Energy Market Analysis – 28-07-2020
28th July 2020 | Posted by: Daniel Birkett | Market Analysis
Gas prices eased down on Monday afternoon as upward movement on coal and carbon markets calmed, while power traded lower. Oil remained flat, while strong wind generation and improved imports balanced the system.
Energy Market Analysis – 27-07-2020
27th July 2020 | Posted by: Daniel Birkett | Market Analysis
Gas prices moved down at the end of last week, pressured down by weaker coal and power, with carbon contracts also dropping by €1. Oil was mostly flat, while the prompt closed down on the back of an expected drop in demand over the weekend and the start of this week.