


Energy Market Analysis - 07-08-2020
7th August 2020 | Posted by: Rebecca Haughton | Market Analysis
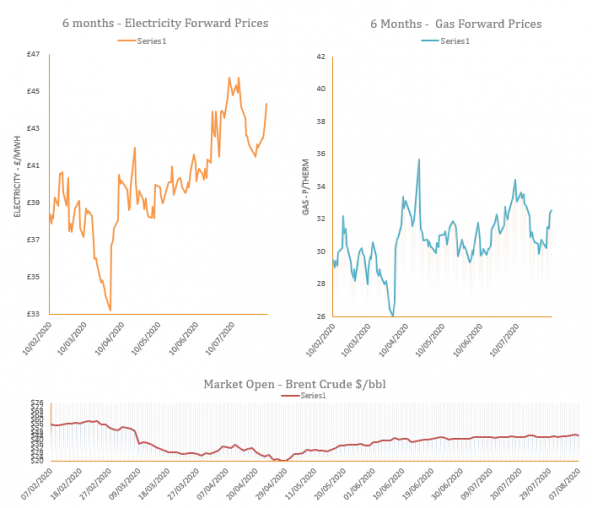
Gas prices rose for a fourth consecutive day, albeit with smaller gains on forward contracts. The Day-Ahead and two front months remained very strong.
Energy Market Analysis - 06-08-2020
6th August 2020 | Posted by: Rebecca Haughton | Market Analysis
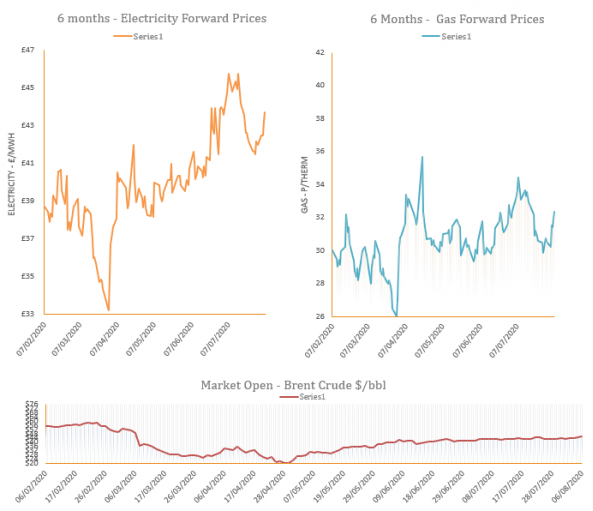
Gas prices continued their ascent yesterday, however the air may be getting thinner as the day on day increase slowed considerably. Part of the lift came from a gain in oil prices, coupled with new highs in equities, coal and carbon were flat.
Energy Market Analysis – 05-08-2020
5th August 2020 | Posted by: Daniel Birkett | Market Analysis
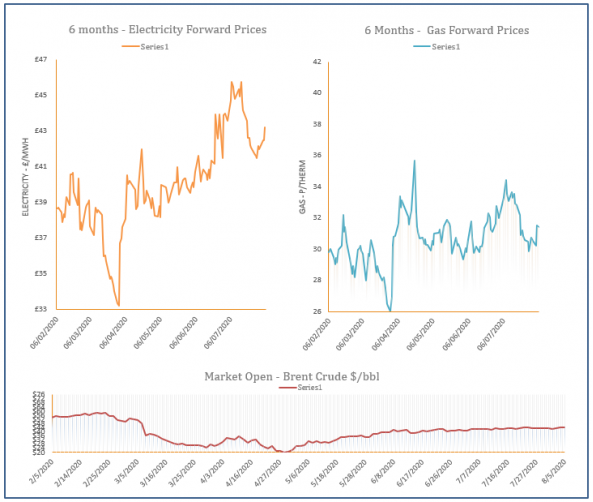
Gas prices continued to move higher in Tuesday’s session as traders closed their short positions en masse. A rise in gas-fired power demand also offered support to the near curve, in addition to a rise in oil, carbon and coal.
Energy Market Analysis – 04-08-2020
4th August 2020 | Posted by: Daniel Birkett | Market Analysis
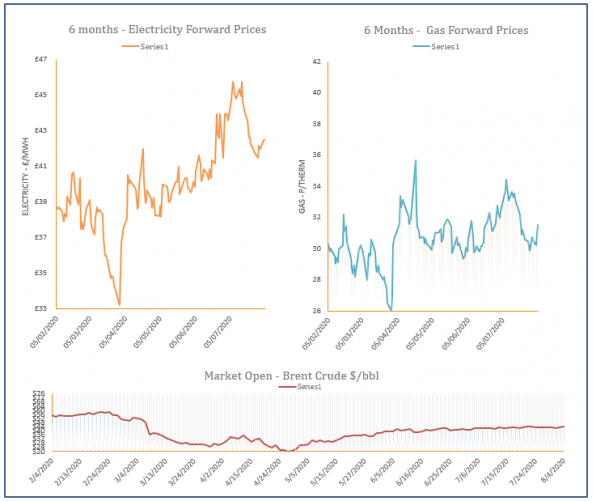
The gas curve climbed higher during August’s first day of trading, with spot prices finding support from low liquidity on trading floors, resulting in a ‘short squeeze’. Further out, prices were lifted by an increase in oil.
Energy Market Analysis – 03-08-2020
3rd August 2020 | Posted by: Daniel Birkett | Market Analysis
Gas prices moved marginally higher at the front of the curve on Friday, whereas contracts from Front-Month onwards traded lower. European markets displayed mixed movement, while commodities were bullish overall.