


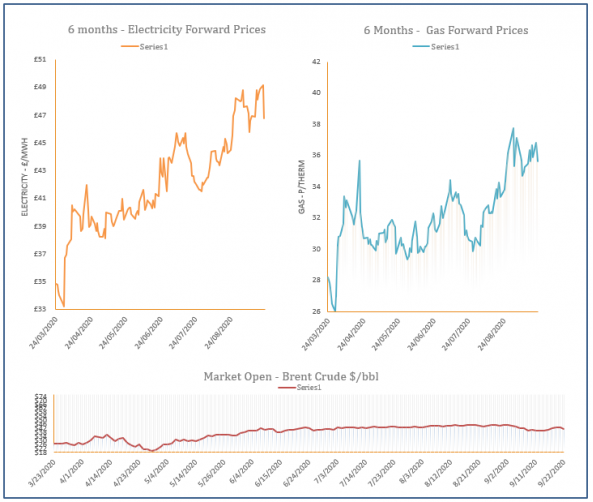
Energy Market Analysis – 23-09-2020
23rd September 2020 | Posted by: Daniel Birkett | Market Analysis
Gas prices inched slightly higher yesterday but failed to erase Monday’s losses. A rise in oil and carbon markets helped to lift contracts, while an oversupplied system weighed on the prompt.
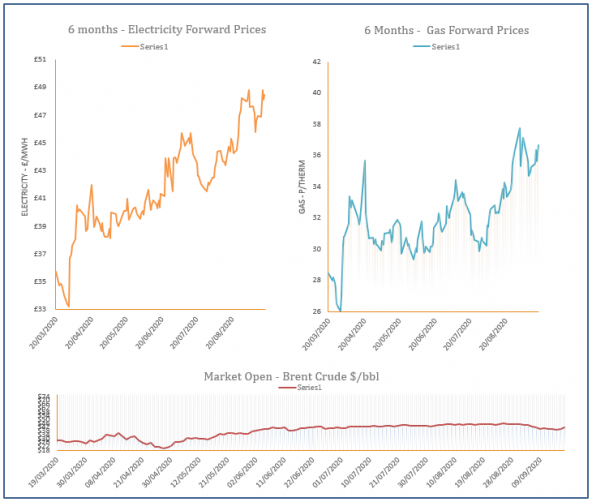
Energy Market Analysis – 22-09-2020
22nd September 2020 | Posted by: Daniel Birkett | Market Analysis
Gas prices dropped off on Monday as fears of another lockdown impacted energy markets across Europe. Oil also recorded a loss, adding to the bearish pressure, while a weaker demand outlook helped the prompt close lower.

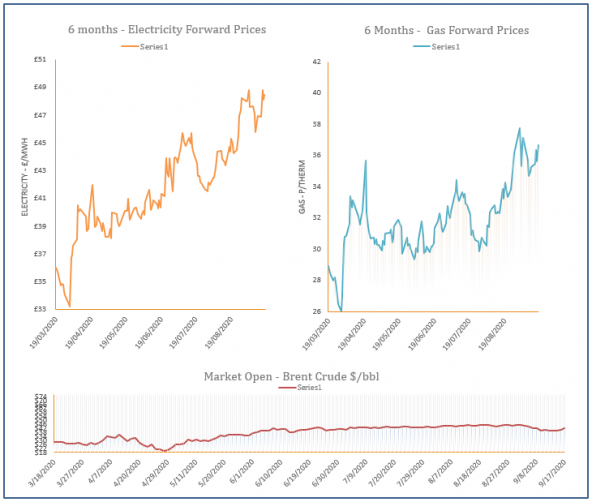
Energy Market Analysis – 21-09-2020
21st September 2020 | Posted by: Daniel Birkett | Market Analysis
Gas prices increased on Friday, displaying an overall bullish trend throughout the week. In terms of commodities, oil markets provided support, coal stabilised, while carbon decreased. A cooler weather outlook and a low renewable power forecast helped to lift the front of the curve.
Energy Market Analysis – 18-09-2020
18th September 2020 | Posted by: Daniel Birkett | Market Analysis
Oil was the only commodity to move higher yesterday, with gas following other markets and trading down. Oil found support from countries reaffirming their commitment to OPEC production cuts, while carbon failed to break the €30 barrier.
Energy Market Analysis – 17-09-2020
17th September 2020 | Posted by: Daniel Birkett | Market Analysis
Gas prices traded higher during Wednesday’s session, with tighter supply contributing to gains on the near curve as imports to the UK decreased. Further out, prices were pushed higher by stronger oil and carbon.