


Energy Market Analysis – 16-09-2020
16th September 2020 | Posted by: Daniel Birkett | Market Analysis
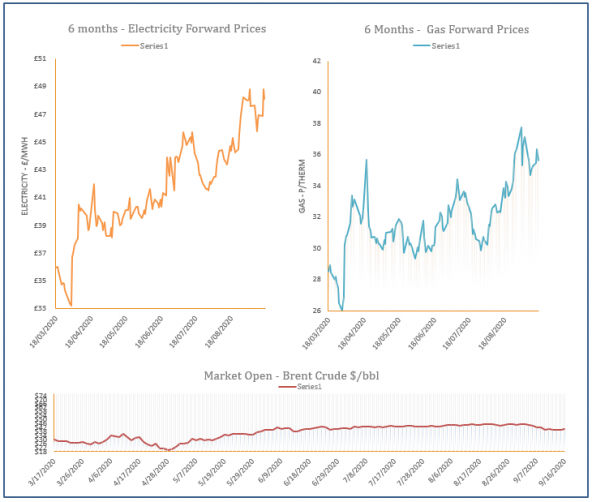
Gas prices moved slightly higher on Tuesday, following upward movement across the broader energy complex. Carbon moved down following strong gains on Monday, while a healthier demand outlook weighed on the prompt.
Energy Market Analysis – 15-09-2020
15th September 2020 | Posted by: Daniel Birkett | Market Analysis
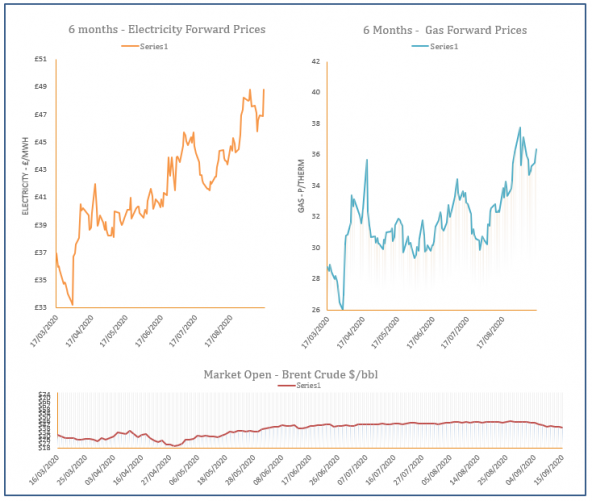
Carbon credits increased by over €2 yesterday which helped to lift energy markets, including gas. Coal and oil markets were mostly flat but gas contracts followed their power counterparts, with a weak renewables outlook lifting the prompt.
Energy Market Analysis – 14-09-2020
14th September 2020 | Posted by: Rebecca Haughton | Market Analysis
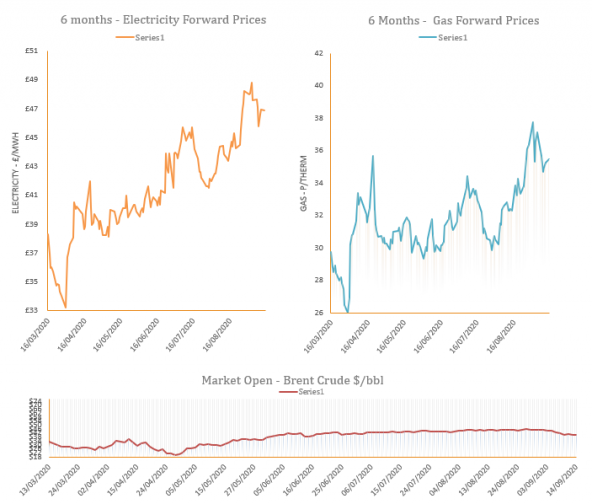
Gas prices managed minor gains on Friday, despite further contractions which saw carbon, oil and most power prices retrace. Equities ended last week down.

Energy Market Analysis – 11-09-2020
11th September 2020 | Posted by: Daniel Birkett | Market Analysis
Gas prices continued to trade sideways yesterday as commodities offered mixed sentiment, with oil trading lower and carbon, coal & power markets recording gains. The system was also tighter due to reduced imports, although an expected rise in renewable power today helped to weigh on the prompt.
Energy Market Analysis – 10-09-2020
10th September 2020 | Posted by: Daniel Birkett | Market Analysis
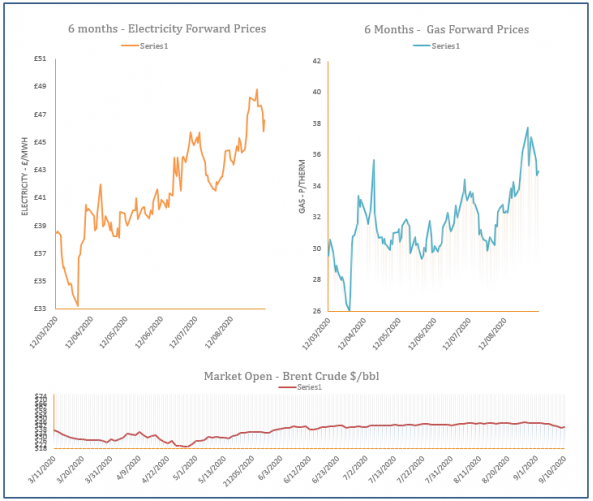
Gas markets stabilised during Wednesday’s session despite a rebound in oil, equities and carbon. Norwegian imports were reduced further, while LNG send-outs were also lower compared to last week. However, revised forecasts point towards warmer weather which is expected to weigh on demand.