


Energy Market Analysis – 09-09-2020
9th September 2020 | Posted by: Daniel Birkett | Market Analysis
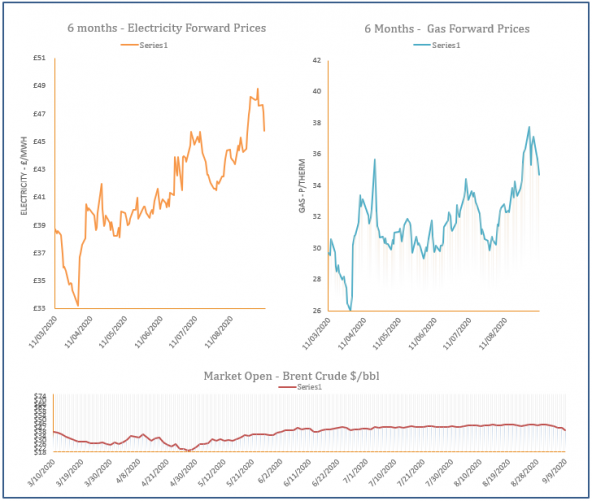
Gas prices decreased again yesterday as the curve was dictated by a strong drop in oil. LNG send-outs were stable but a decline in imports from Norway and a rise in gas-fired power demand tightened the system, offering support to the prompt.

Energy Market Analysis – 08-09-2020
8th September 2020 | Posted by: Daniel Birkett | Market Analysis
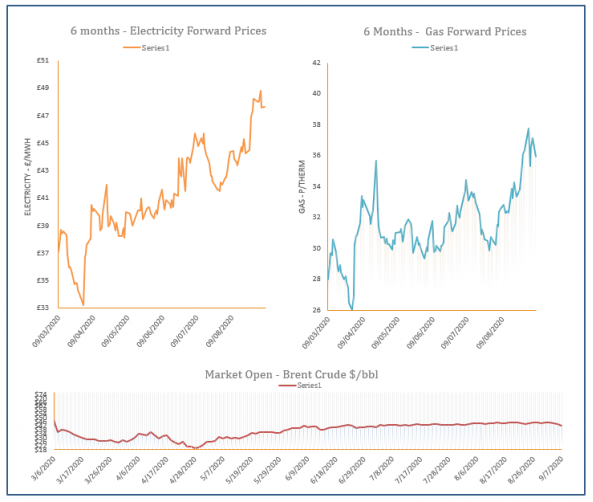
Gas prices eased down yesterday, with coal, oil and carbon markets all closing lower, contributing to losses at the back of the curve. The front of the curve was dictated by a colder weather outlook, with a slight drop in renewable power also expected today.
Energy Market Analysis – 07-09-2020
7th September 2020 | Posted by: Daniel Birkett | Market Analysis
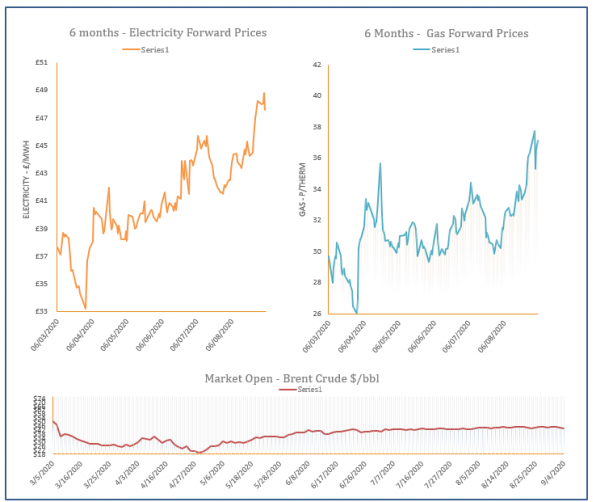
Gas prices found bearish resistance from a fall in oil, coal and carbon on Friday, despite opening the session higher. The system was long throughout the session but an expected drop in renewables over the weekend offered some support to the prompt.
Energy Market Analysis – 04-09-2020
4th September 2020 | Posted by: Daniel Birkett | Market Analysis
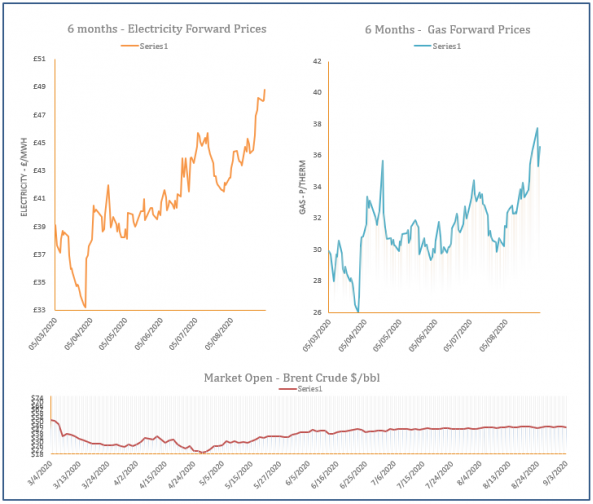
Gas prices increased at the start of the session, following upward movement on stock markets. However, a downturn in oil prices helped to weigh on contracts in the afternoon. Meanwhile, the system was balanced with the help of high wind levels and stable imports.
Energy Market Analysis – 03-09-2020
3rd September 2020 | Posted by: Daniel Birkett | Market Analysis
Gas prices were pressured down by weakening across the broader energy complex yesterday. Oil, coal and power all traded lower, with only carbon posting a gain. The system was oversupplied throughout the session which helped to weigh on the prompt.