


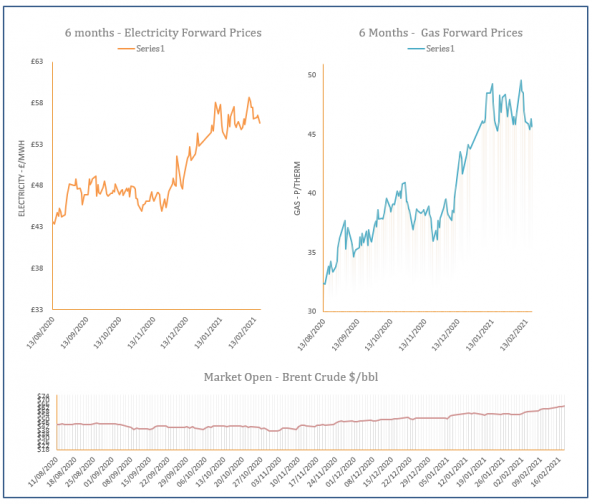
Energy Market Analysis – 19-02-2021
19th February 2021 | Posted by: Daniel Birkett | Market Analysis
Outages in Norway and the UKCS limited imports into the UK yesterday and tightened the system, despite lower demand levels. Rising global markets also offered support to contracts, with Arctic conditions in the US the main market driver.
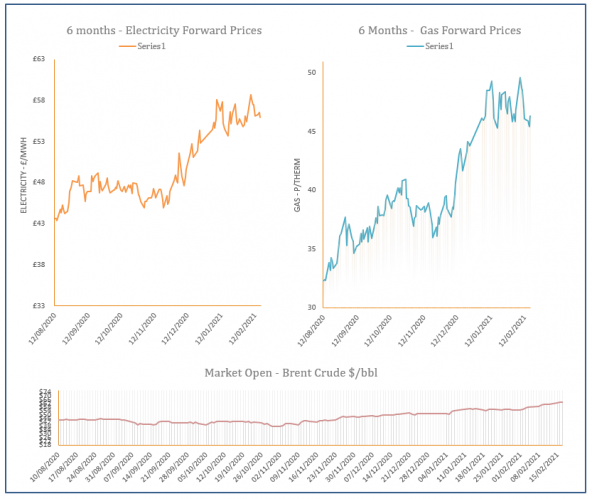
Energy Market Analysis – 18-02-2021
18th February 2021 | Posted by: Daniel Birkett | Market Analysis
A decrease in flows to the UK sent the system short during Wednesday’s session despite very low demand. Mild weather and stronger renewable generation reduced both LDZ and CCGT demand, while LNG send-outs remained high. However, additional support was provided an increase in wider commodities due to a rise in US prices.
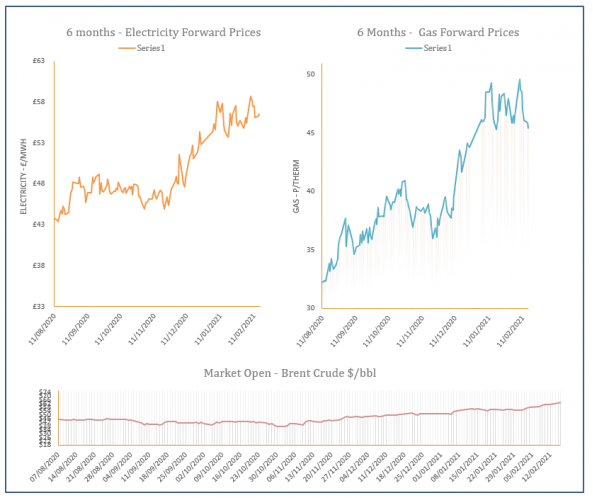
Energy Market Analysis – 17-02-2021
17th February 2021 | Posted by: Daniel Birkett | Market Analysis
Unplanned outages at facilities connected to the Langeled and UKCS pipelines reduced flows into the UK yesterday, tightening the system. A healthy LNG outlook helped to offset any bullish sentiment, while rising oil offered some upward pressure further along the curve.
Energy Market Analysis – 16-02-2021
16th February 2021 | Posted by: Daniel Birkett | Market Analysis
LNG send-outs remained high, with another flurry of deliveries expected before the end of the month. Mild weather also reduced demand and the system was oversupplied, with temperatures expected to hold current levels throughout February – this resulted in losses across the near gas curve.

Energy Market Analysis – 15-02-2021
15th February 2021 | Posted by: Daniel Birkett | Market Analysis
A milder weather forecast for this week and the remainder of February helped gas prices close at a discount. Strong imports and high LNG send-outs also kept the system oversupplied, while healthy wind generation reduced CCGT demand.