


Energy Market Analysis - 05-02-2021
5th February 2021 | Posted by: Daniel Birkett | Market Analysis
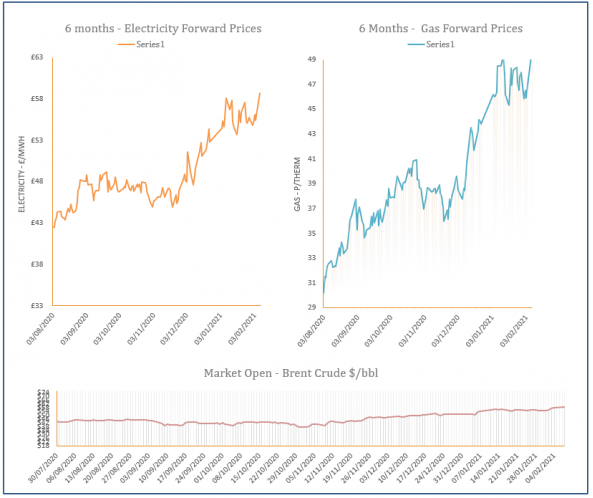
Temperatures for next week were revised lower and are forecast to drop well below the seasonal average, lifting residential heating demand. A healthy LNG outlook for February offered some resistance, while an expected drop in renewable power today provided support to the prompt.
Energy Market Analysis – 04-02-2021
4th February 2021 | Posted by: Daniel Birkett | Market Analysis
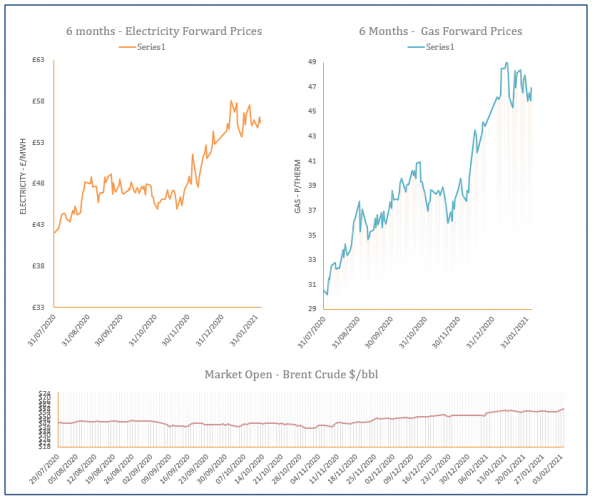
An oversupplied system and a healthy LNG outlook resulted in losses across the near gas curve during Wednesday’s session. Further out, fuel markets offered support, with oil markets increasing for the third session in a row.
Energy Market Analysis – 03-02-2021
3rd February 2021 | Posted by: Daniel Birkett | Market Analysis
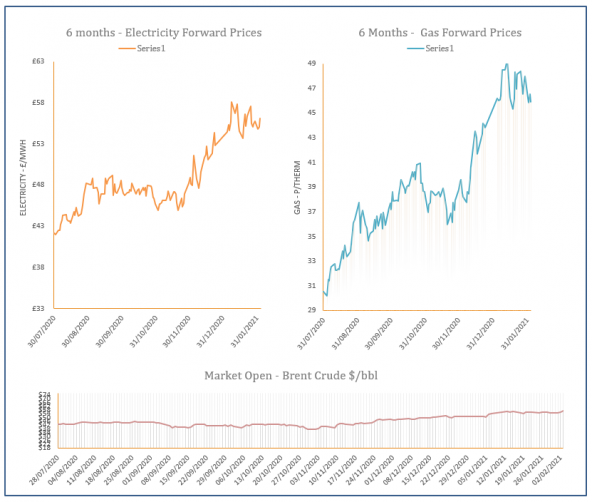
Improved wind levels reduced reliance of gas-fired power yesterday, while a flurry of LNG deliveries are also expected to dock in the UK over the next ten days, weighing on near curve gas prices. Meanwhile, movement at the back of the curve was slightly bullish due to rising oil markets.
Energy Market Analysis – 02-02-2021
2nd February 2021 | Posted by: Daniel Birkett | Market Analysis
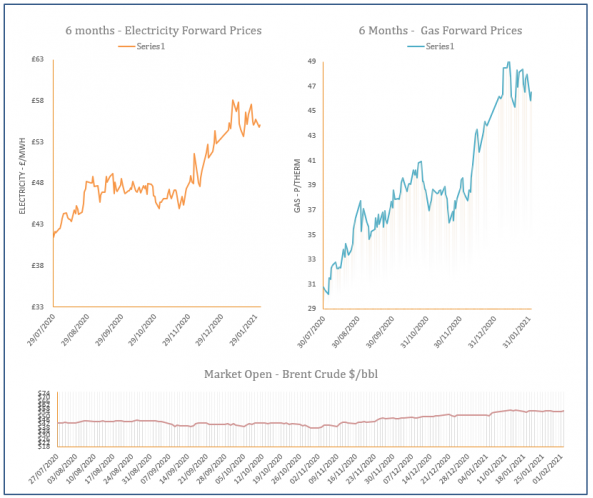
Near curve gas prices weakened yesterday as a busy period of LNG deliveries is scheduled for the next couple of weeks. Cold weather offered some resistance but wind levels were expected to increase significantly today, resulting in a loss on the prompt, while oil markets also strengthened.

Energy Market Analysis – 01-02-2021
1st February 2021 | Posted by: Daniel Birkett | Market Analysis
A colder weather outlook for the weekend and the start of this week, combined with low renewable power generation offered support to the prompt and near curve gas prices on Friday, as demand levels were forecast to increase strongly.