


Energy Market Analysis – 17-03-2021
17th March 2021 | Posted by: Daniel Birkett | Market Analysis
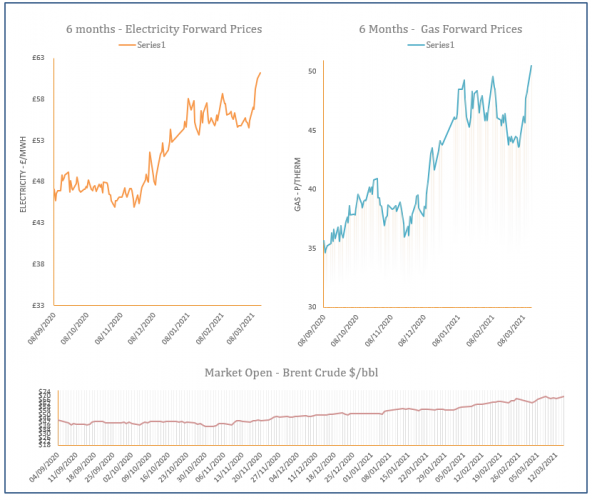
Improved imports, a drop in demand and high LNG send-outs resulted in a long UK gas system yesterday which helped to pressure down near curve prices. Meanwhile, longer dated contracts followed falling oil markets.

Energy Market Analysis – 16-03-2021
16th March 2021 | Posted by: Daniel Birkett | Market Analysis
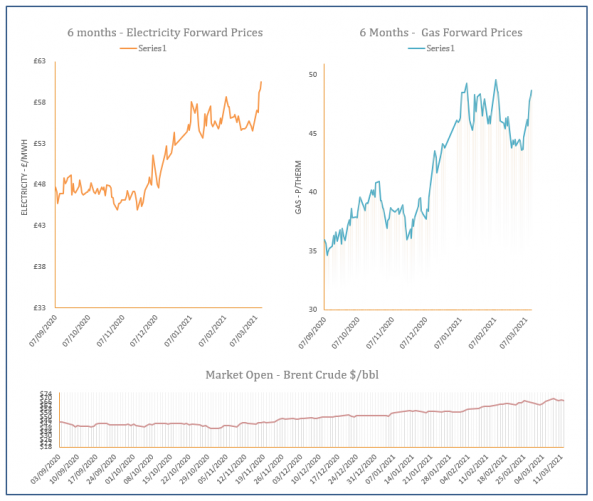
Gas prices continued to move higher during Monday’s session, following a rise in commodities. However, any upward movement on the near curve was offset by a long system and a weaker demand forecast.
Energy Market Analysis – 15-03-2021
15th March 2021 | Posted by: Daniel Birkett | Market Analysis
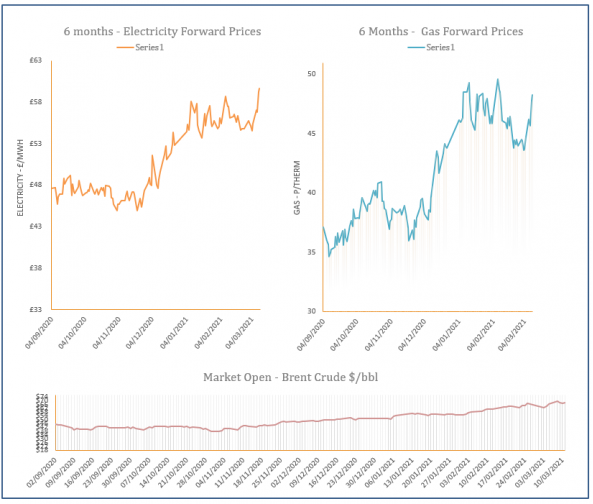
The return of Norwegian processing facilities and an expected rise in temperatures this week resulted in losses across the near gas curve on Friday. Movement further out was generally stable with some bullish pressure provided by a healthier outlook for oil markets.
Energy Market Analysis – 12-03-2021
12th March 2021 | Posted by: Daniel Birkett | Market Analysis
Gas contracts increased yesterday on the back of concerns regarding UK and European storage levels and ongoing outages in Norway, with additional support provided by a rebound in oil.
Energy Market Analysis – 11-03-2021
11th March 2021 | Posted by: Daniel Birkett | Market Analysis
Outages at Norwegian oil facilities limited imports into the UK yesterday, with restrictions expected to continue until the weekend. This resulted in gains across the gas curve, with the drop in temperatures also lifting demand for heating.