


Energy Market Analysis – 22-04-2021
22nd April 2021 | Posted by: Daniel Birkett | Market Analysis
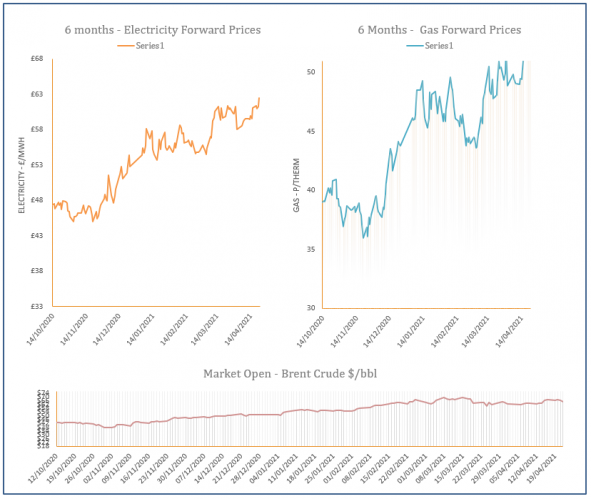
Gas contracts moved higher yesterday as carbon markets increased strongly and annual maintenance in Norway is expected to reduce imports into the UK. Cooler temperatures and weak renewable generation is also forecast for next week, lifting demand.
Energy Market Analysis – 21-04-2021
21st April 2021 | Posted by: Daniel Birkett | Market Analysis
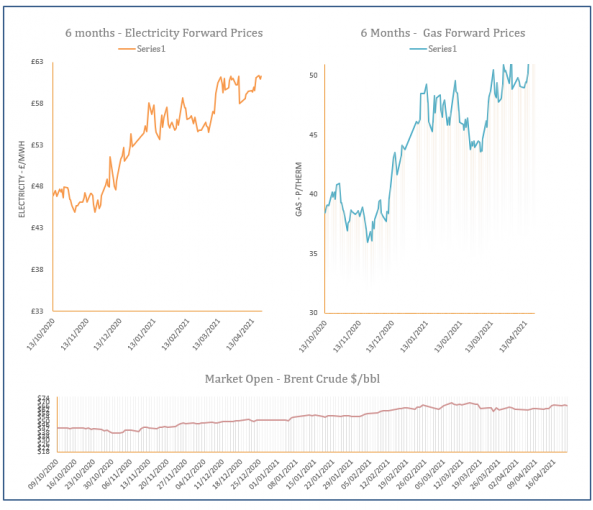
The system was well-supplied throughout Tuesday’s session, helped by high LNG send-outs. This resulted in losses across the near curve, while movement further out was largely stable.
Energy Market Analysis – 20-04-2021
20th April 2021 | Posted by: Daniel Birkett | Market Analysis
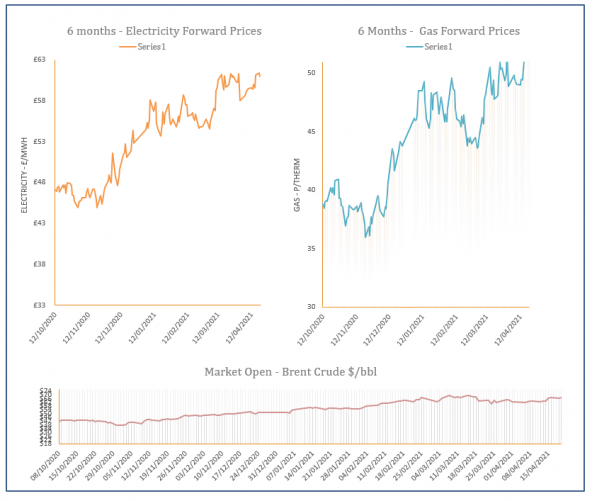
Flows via the UK Interconnector and Langeled pipelines were expected to increase further today, helping to weigh on some near curve contracts yesterday afternoon. LNG send-outs also remain extremely comfortable due to a high number of deliveries this month.
Energy Market Analysis – 19-04-2021
19th April 2021 | Posted by: Daniel Birkett | Market Analysis
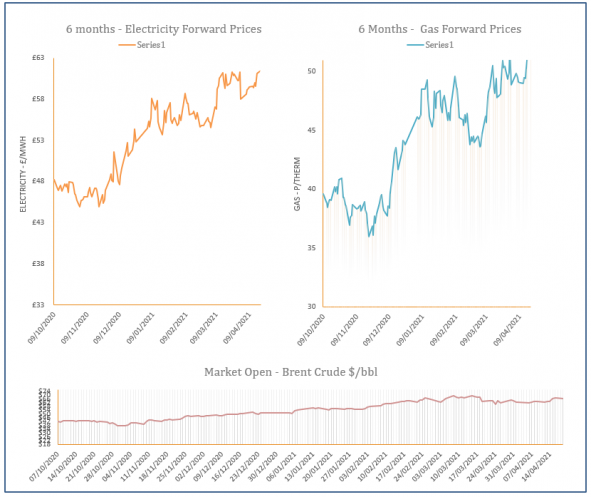
Increases on oil markets dictated movement across the overall energy complex, with gas contracts displaying further gains. An expected drop in temperatures and weak wind generation also offered additional support to the spot.

Energy Market Analysis – 16-04-2021
16th April 2021 | Posted by: Daniel Birkett | Market Analysis
Sentiment on the gas curve was similar to previous days, with contracts rising steadily on the back of a recovering oil market which has set the tempo for wider commodities and energy markets.