


Energy Market Analysis - 04-05-2016
4th May 2016 | Posted by: Daniel Birkett | Market Analysis
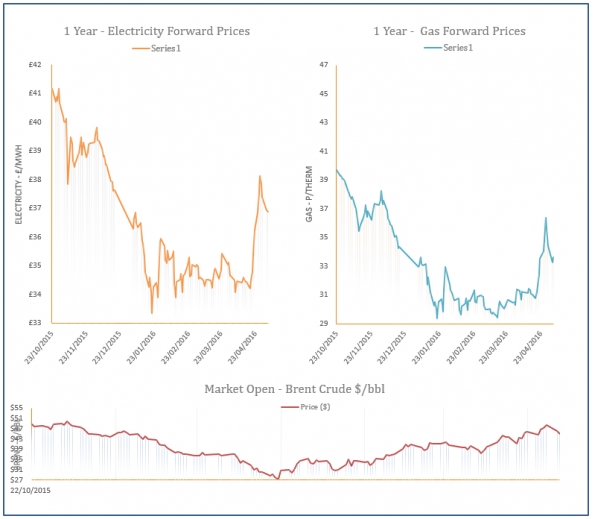
A decrease in UK gas demand and a drop in oil prices contributed to losses across the gas curve on Tuesday, with the downward movement more visible on the near-curve. Demand levels fell by 40mcm compared to Friday as milder weather led to lower residential consumption, with levels expected to fall further later in the week. Meanwhile, an outage at the Rough storage facility limited storage injections, with excess flows exported to Belgium; restricting some of the losses.

Energy Market Analysis - 03-05-2016
3rd May 2016 | Posted by: Daniel Birkett | Market Analysis
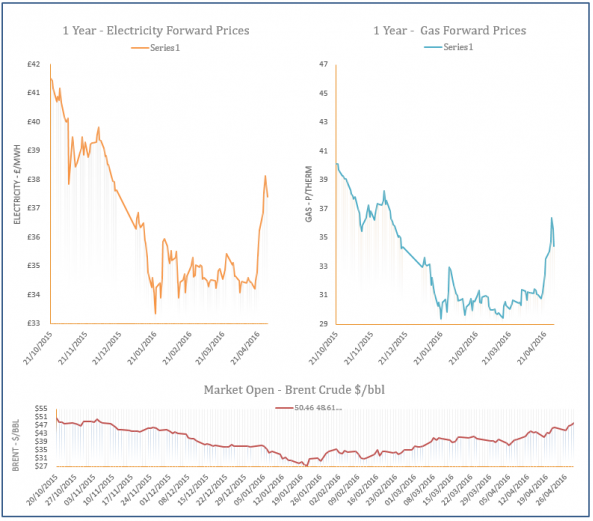
There was very little trading yesterday due to the Bank Holiday in the UK, with only 3 contracts trading on the Dutch TTF (Title Transfer Facility) market, compared to 80 on Friday. The movement on these contracts was bearish with a milder weather forecast for May and falling oil prices weighing on the market. Gas demand in the UK was 21% lower than Friday, while imports from Norway remained comfortable.
Energy Market Analysis - 29-04-2016
29th April 2016 | Posted by: Daniel Birkett | Market Analysis
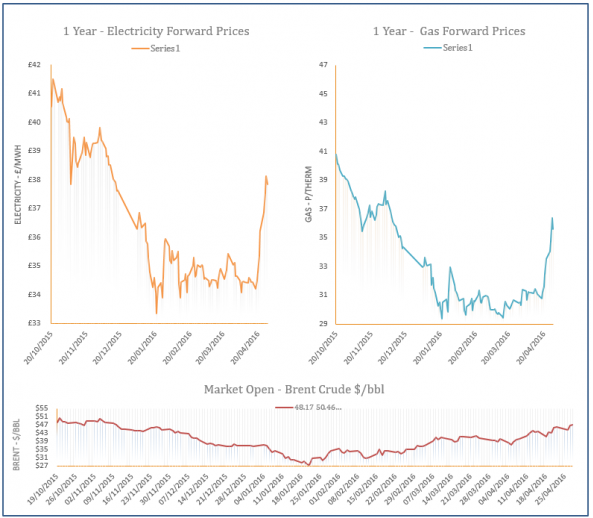
LNG send-outs, BBL flows and Norwegian imports all ramped up yesterday, sending the UK gas system into oversupply which resulted in losses across the near gas curve. Warmer temperatures are also expected to return next week which will reduce demand levels, further weighing on prompt contracts. However, rising Brent limited some of the bearish movement further along the curve.
Energy Market Analysis - 28-04-2016
28th April 2016 | Posted by: Daniel Birkett | Market Analysis
A warmer weather outlook for next week helped to weigh on gas contracts yesterday afternoon, with further downward pressure coming from healthy LNG flows. Gas demand in the UK increased once again yesterday which supported prompt contracts in the morning, while rising Brent helped towards gains on the far curve.

Energy Market Analysis - 27-04-2016
27th April 2016 | Posted by: Daniel Birkett | Market Analysis
Gas consumption increased once again yesterday as temperatures were at their coldest for two weeks; residential demand rose by 15mcm to 189mcm. LNG flows remained healthy with further deliveries expected in the UK before the end of the month which helped to limit some of the gains, although the gas system remained short. A late rally in oil prices also offered support to far-curve contracts.