


Energy Market Analysis - 11-11-2015
11th November 2015 | Posted by: Daniel Birkett | Market Analysis
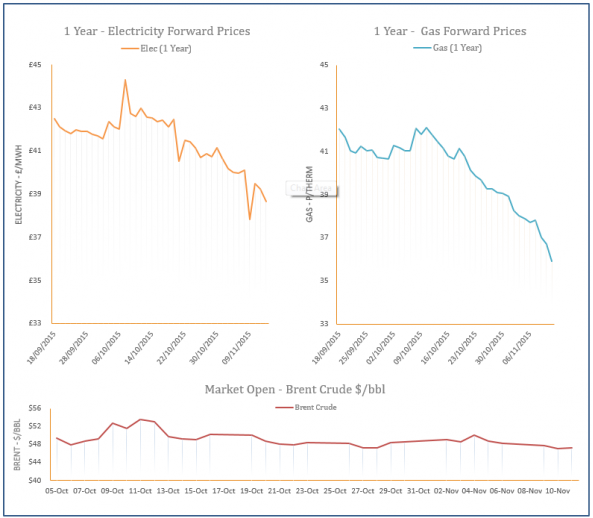
Residential demand and gas-fired power generation in the UK was low yesterday, resulting in an oversupplied system and a decrease in prices. Oil prices also weakened and overall supply levels were comfortable as bearish movement was displayed throughout the session.
Energy Market Analysis - 10-11-2015
10th November 2015 | Posted by: Daniel Birkett | Market Analysis
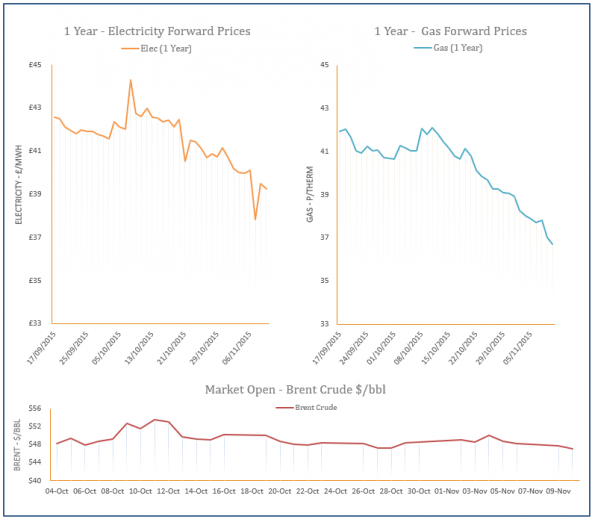
Weaker residential demand and healthy supply levels weighed on gas contracts yesterday. Demand rose to 139mcm, compared to 116mcm on Friday but still remains well below the seasonal norm, while stronger wind levels lessened the UK’s need for gas-fired generation. The UK gas system was oversupplied as a result, also helped by strong Norwegian imports and a rise in LNG send-outs.
Energy Market Analysis - 09-11-2015
9th November 2015 | Posted by: Daniel Birkett | Market Analysis
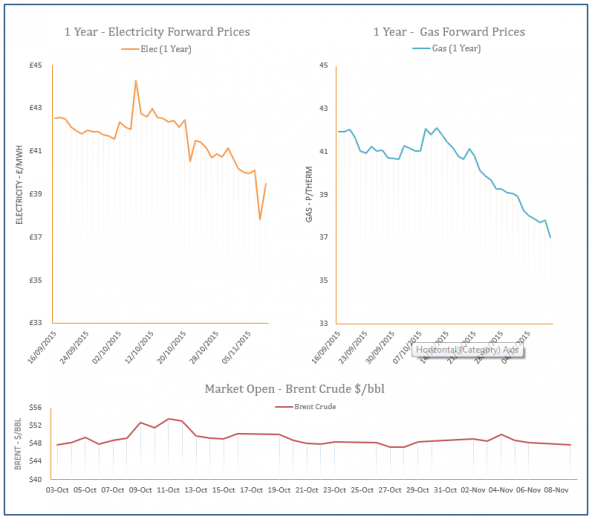
Gas prices moved higher Friday morning as an outage at the South Hook LNG terminal reduced supply levels in the UK. However, the outage was resolved in the afternoon and a milder weather forecast helped contracts to shed from their price, with further bearish pressure coming from an oversupplied system.
Energy Market Analysis - 06-11-2015
6th November 2015 | Posted by: Daniel Birkett | Market Analysis
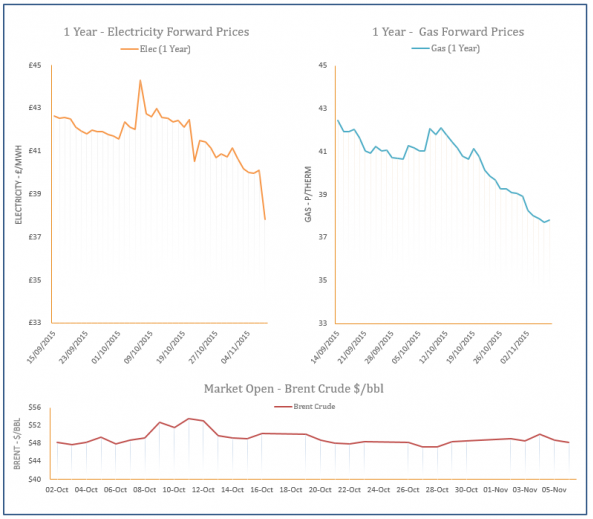
An oversupplied gas system helped gas prices to decrease yesterday as demand levels were below average due to milder weather and BBL flows resumed. Residential demand was 22% below the seasonal norm, while BBL flows rose to around 12mcm. Losses were also evident further along the curve with further downward pressure coming from weaker fuel prices.
Energy Market Analysis - 05-11-2015
5th November 2015 | Posted by: Daniel Birkett | Market Analysis
Maintenance in Norway continued to restrict flows in to the UK but above average temperatures and strong LNG supply resulted in a long gas system, contributing to losses across the near-curve. However, the downward movement was restricted by a halt in BBL flows and an increase in gas-fired power generation, while stronger oil and coal supported the far-curve.