


Energy Market Analysis – 02-06-2021
2nd June 2021 | Posted by: Daniel Birkett | Market Analysis
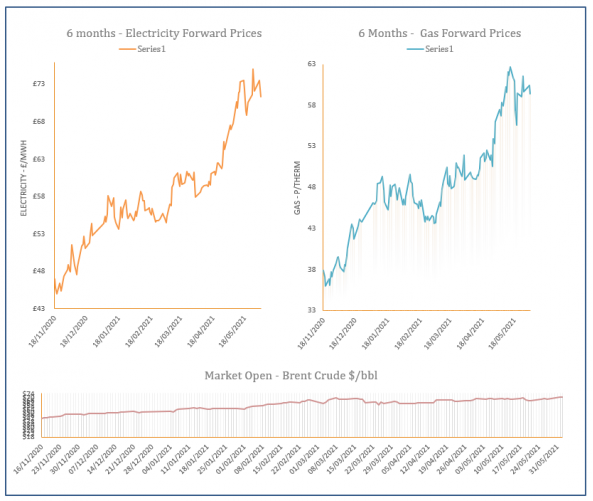
Gas prices inched higher during Tuesday’s session despite weak demand as annual maintenance at production facilities and unseasonably low storage levels offered support. Bullish commodities also helped towards gains at the back of the curve.
Energy Market Analysis – 01-06-2021
1st June 2021 | Posted by: Daniel Birkett | Market Analysis
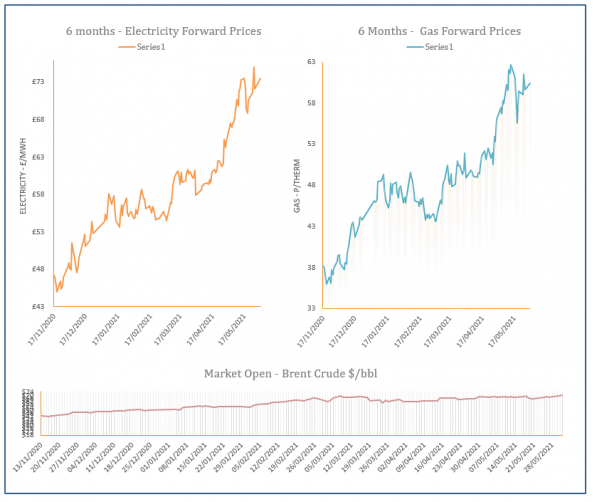
A warm weather forecast and the expected delivery of 4 LNG cargoes over the Bank Holiday weekend helped to weigh on gas prices during Friday’s session. However, rising oil helped to limit losses further along the curve.

Energy Market Analysis – 27-05-2021
27th May 2021 | Posted by: Daniel Birkett | Market Analysis
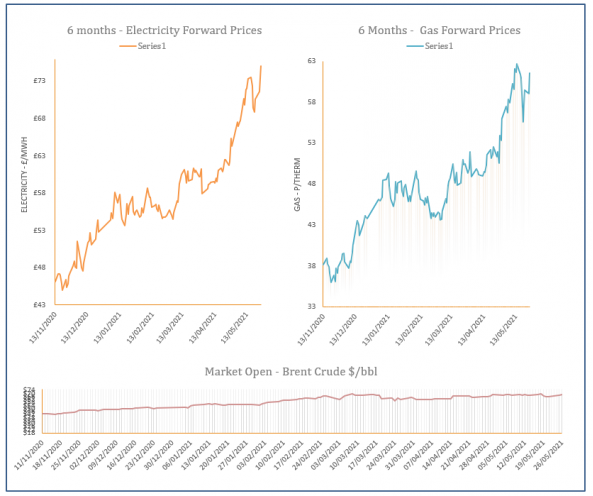
Cooler weather and low renewable power generation lifted gas demand yesterday, while maintenance in the North Sea limited supply. This resulted in strong upward movement across the near gas curve.
Energy Market Analysis – 26-05-2021
26th May 2021 | Posted by: Daniel Birkett | Market Analysis
Gas prices remained bullish during Tuesday’s session as fuel markets continued to move upwards and the supply/ demand picture tightened.
Energy Market Analysis – 25-05-2021
25th May 2021 | Posted by: Daniel Birkett | Market Analysis
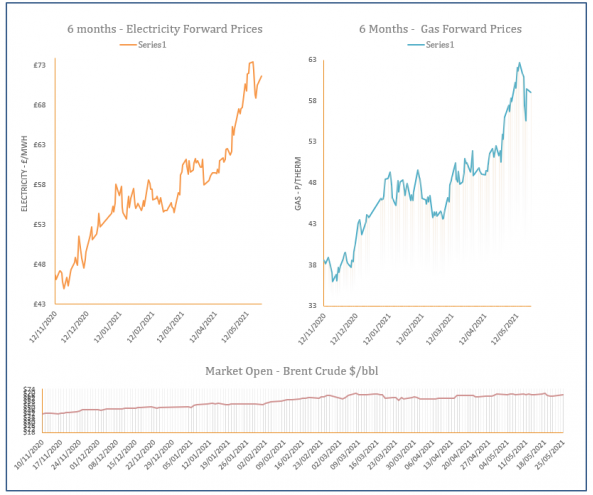
A balanced system and an improved LNG outlook helped most contracts on the near gas curve move down during Monday’ session. However, far curve contracts were supported by recovering commodity markets.