


Energy Market Analysis – 29-04-2021
29th April 2021 | Posted by: Daniel Birkett | Market Analysis
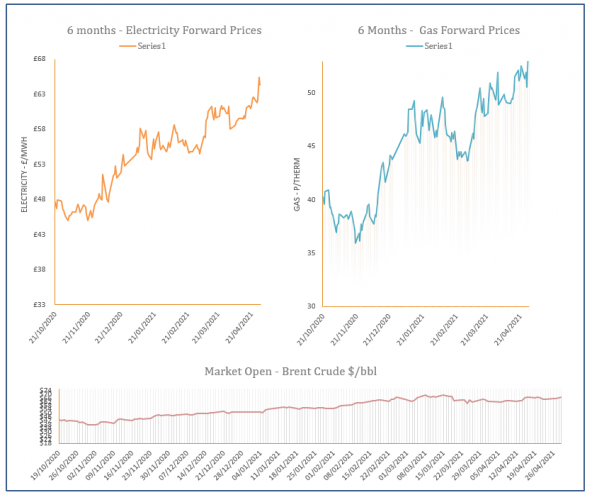
Storage levels continued to deplete yesterday, with similar withdrawals expected for the remainder of the month; withdrawals are around 1mcm higher than they were this time last year. Prices went up as a result of tighter storage levels, combined with higher demand.
Energy Market Analysis – 28-04-2021
28th April 2021 | Posted by: Daniel Birkett | Market Analysis
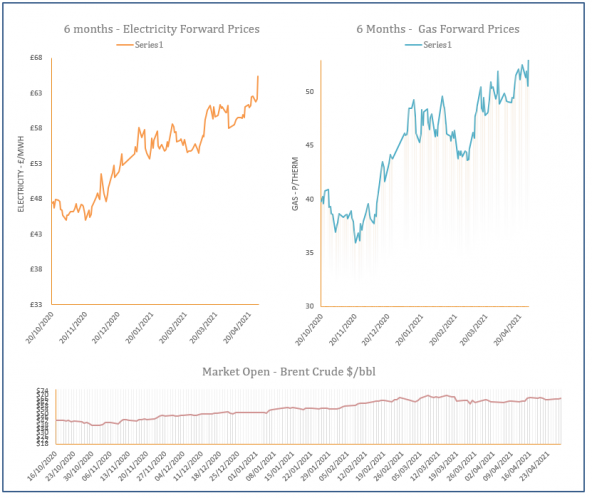
A reduction in Russian flows into Europe had a knock-on effect for the UK yesterday, offering support to contracts in the afternoon. Cooler temperatures continued to lift residential demand but an expected rise in wind generation today offered some resistance.

Energy Market Analysis – 26-04-2021
26th April 2021 | Posted by: Daniel Birkett | Market Analysis
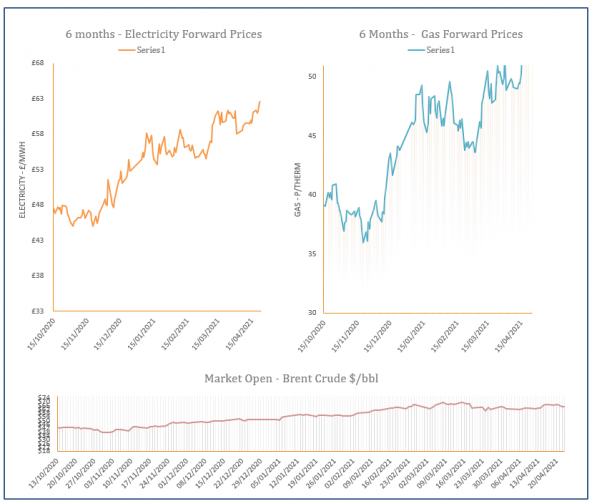
The higher demand outlook for the final week of April, plus bullish movement displayed by EU carbon contracts continued to provide upward pressure along the gas curve on Friday.
Energy Market Analysis – 23-04-2021
23rd April 2021 | Posted by: Daniel Birkett | Market Analysis
Rising carbon markets and expectations of high demand as we head into May helped gas prices climb higher yesterday. Reduced renewable power and cooler weather is expected next week but supply levels are healthy thanks to strong LNG send-outs.
Energy Market Analysis – 22-04-2021
22nd April 2021 | Posted by: Daniel Birkett | Market Analysis
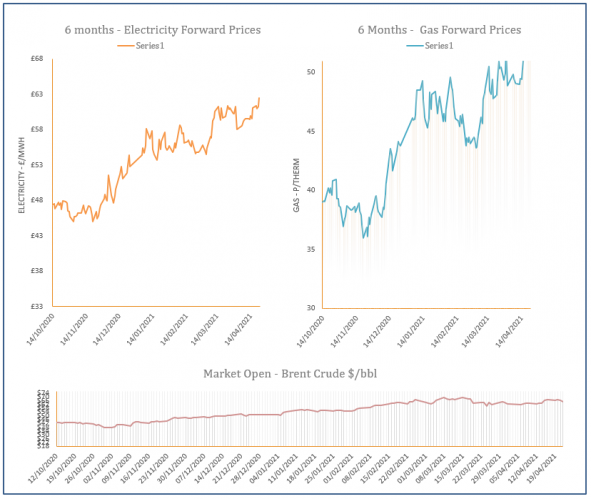
Gas contracts moved higher yesterday as carbon markets increased strongly and annual maintenance in Norway is expected to reduce imports into the UK. Cooler temperatures and weak renewable generation is also forecast for next week, lifting demand.