


Apollo Energy publishes a daily energy market analysis, focusing on the gas, power and oil markets including a commentary on how the markets close and open. Our analysis provides insight on how the markets are performing and also considers various factors which could dictate price changes in the future.
The analysis also contains a graph which tracks the one-year forward price of both gas and electricity as well as changes to Brent crude oil.
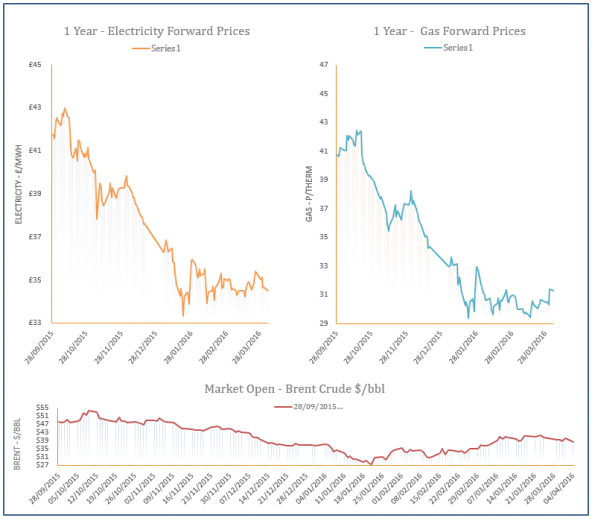
Energy Market Analysis - 04-04-2016
4th April 2016 | Posted by: Daniel Birkett | Market Analysis
Gas contracts were on the decline on Friday due to a healthy supply/ demand outlook and falling oil prices. Mild temperatures were expected for the start of April, reducing demand levels across Europe, while Russian and Norwegian flows into the continent remained strong. However, some of the losses on the near-curve were restricted by a drop in the Pound against the Euro.
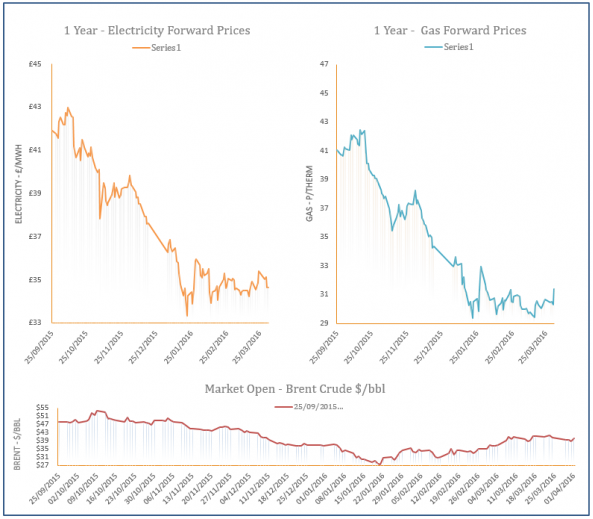
Energy Market Analysis - 01-04-2016
1st April 2016 | Posted by: Daniel Birkett | Market Analysis
Gas contracts moved higher on Thursday as temperatures remained cold, resulting in a tighter gas system, although mild temperatures are expected over the weekend. Near-curve contracts also received support from a weaker Pound and gas-fired power generation is set to rise due to weak renewables.