


Apollo Energy publishes a daily energy market analysis, focusing on the gas, power and oil markets including a commentary on how the markets close and open. Our analysis provides insight on how the markets are performing and also considers various factors which could dictate price changes in the future.
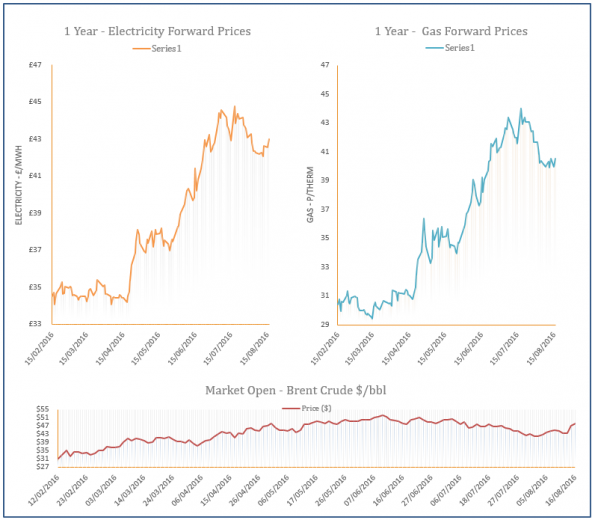
The analysis also contains a graph which tracks the one-year forward price of both gas and electricity as well as changes to Brent crude oil.

Energy Market Analysis - 18-08-2016
18th August 2016 | Posted by: Daniel Birkett | Market Analysis
The UK gas system moved into oversupply yesterday which applied downward pressure on the near-curve in the afternoon, during a session of mixed movement. The system was 20mcm long, helped by weaker demand and resulted in a loss on the prompt. Further out, an increase in oil prices helped contracts climb higher, ignoring a rebound in the Pound.

Energy Market Analysis - 17-08-2016
17th August 2016 | Posted by: Daniel Birkett | Market Analysis
Gas contracts ignored weaker demand levels on Tuesday with a stronger Dollar and gains on the oil market dictating the curve. Brent continues to act as the main market driver for gas following comments made by OPEC members in regards to working towards market stability and being open to a potential freeze on oil production.
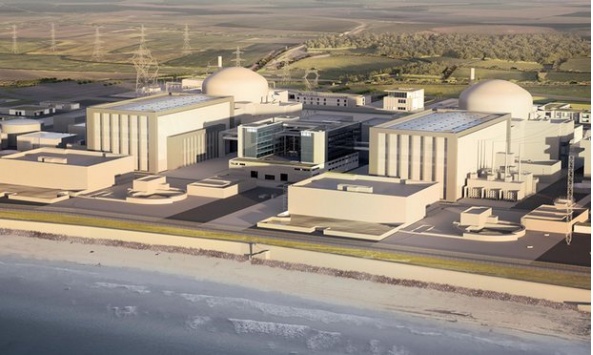
Does the UK need Hinkley Point C?
17th August 2016 | Posted by: Daniel Birkett | Industry News
SSE Chief Executive, Alistair Phillips-Davies claims that there are enough ‘credible alternative projects’ in the UK to meet the nation’s needs, should Hinkley Point not go ahead.
Energy Market Analysis - 16-08-2016
16th August 2016 | Posted by: Daniel Birkett | Market Analysis
Near-curve gas contracts decreased on Monday as supply levels improved and helped the system remain long throughout the session, with warmer weather also leading to weaker demand levels. Norwegian imports into the UK via the Langeled pipeline strengthened at the end of last week, while gas stocks are higher than expected. However, bearish movement further along the curve was slightly restricted by rising Brent.

Energy Market Analysis - 15-08-2016
15th August 2016 | Posted by: Daniel Birkett | Market Analysis
A rising oil market supported contracts on the far gas curve on Friday, with a reported increase in demand fuelling bullish sentiment. Meanwhile, an expected rise in temperatures this week helped to restrict upward movement at the front of the curve, with improved supply levels also contributing to a long system.