


Apollo Energy publishes a daily energy market analysis, focusing on the gas, power and oil markets including a commentary on how the markets close and open. Our analysis provides insight on how the markets are performing and also considers various factors which could dictate price changes in the future.
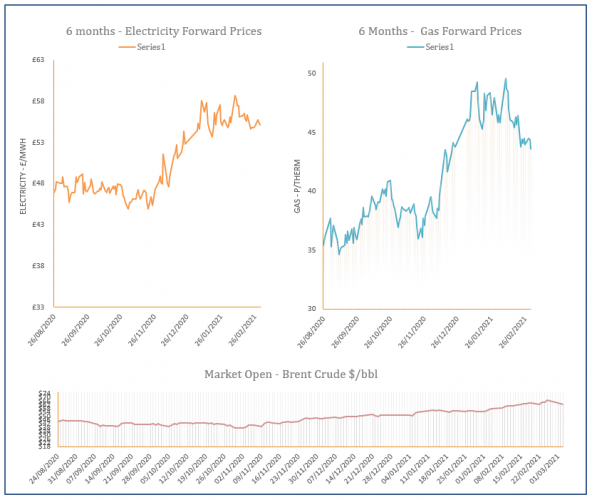
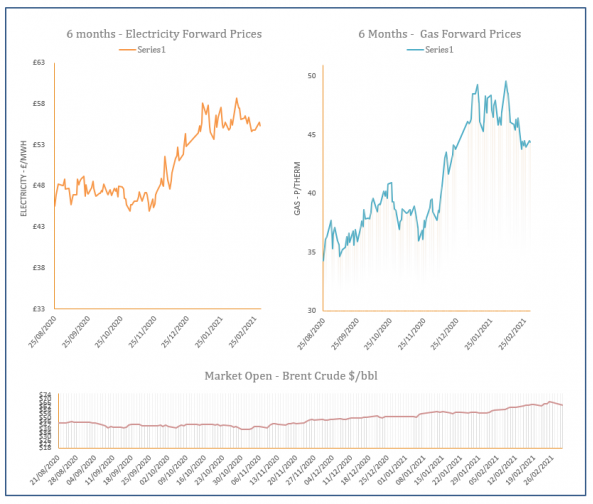
The analysis also contains a graph which tracks the one-year forward price of both gas and electricity as well as changes to Brent crude oil.
Energy Market Analysis – 03-03-2021
3rd March 2021 | Posted by: Daniel Birkett | Market Analysis
The expected influx of LNG deliveries helped towards losses yesterday, although the current cold spell and very limited renewable power offered resistance as demand is considerably higher than last week’s levels.
Energy Market Analysis – 02-03-2021
2nd March 2021 | Posted by: Daniel Birkett | Market Analysis
Gas prices started the week on a bullish note on the back of a significant rise in demand which tested the system. Flows via the Langeled pipeline were close to capacity but additional storage withdrawals were required to meet demand.

Energy Market Analysis – 01-03-2021
1st March 2021 | Posted by: Daniel Birkett | Market Analysis
A tighter gas system was forecast for the start of this week due to low wind generation and cooler weather. However, healthy imports kept the system oversupplied during the session, while a drop in oil offered some bearish resistance further along the curve.