Energy Market Analysis - 07-01-2016
7th January 2016 | Posted by: Daniel Birkett | Market Analysis
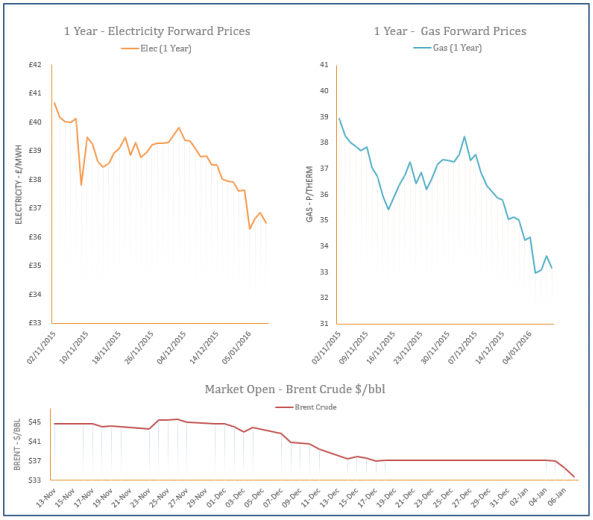
The UK gas system is 27mcm long this morning and above-average temperatures are expected to return later in the month, helping to weigh on gas contracts across the near-curve. Another strong drop in Brent has also weighed on contracts further along the curve in a bearish opening to the session.
Energy Market Analysis - 06-01-2016
6th January 2016 | Posted by: Daniel Birkett | Market Analysis
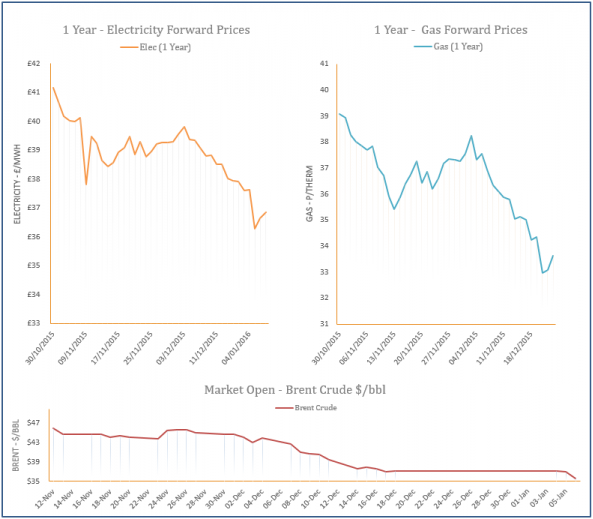
Gas prices moved higher yesterday morning on the back of a colder weather forecast for next week which will lead to a rise in demand. However, a fall in oil prices provided downward pressure on the curve, erasing the session’s early gains. The British Pound also strengthened against the Euro which weighed on contracts further.
Energy Market Analysis - 05-01-2016
5th January 2016 | Posted by: Daniel Birkett | Market Analysis
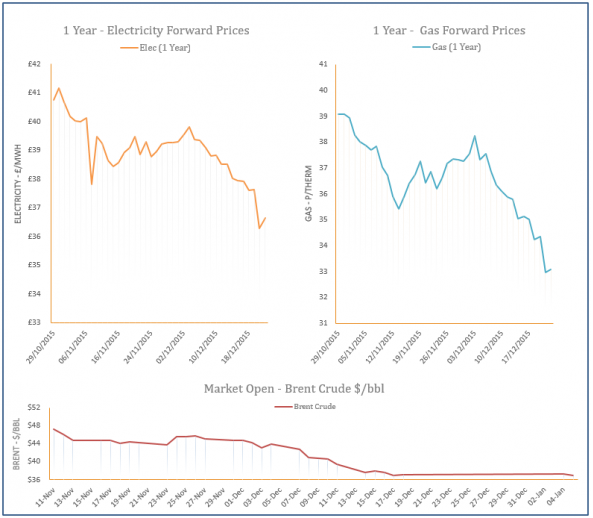
Most gas prices moved down yesterday but the prompt climbed higher on the back of increased industrial demand, colder temperatures and a decrease in Dutch production. Despite early morning gains, Brent corrected downwards in the afternoon which had a bearish effect on contracts further along the curve.
Energy Market Analysis - 04-01-2016
4th January 2016 | Posted by: Daniel Birkett | Market Analysis
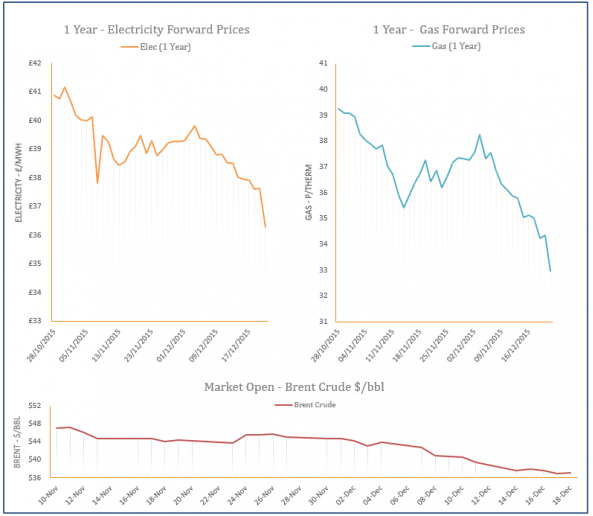
Prices initially opened higher in the first trading session following the Christmas holidays as a colder weather forecast offered support to the near-curve. However, temperatures still remain mild for this time of year and supply levels were healthy which helped contracts to come down in the afternoon.


