Energy Market Analysis - 16-05-2018
16th May 2018 | Posted by: Daniel Birkett | Market Analysis
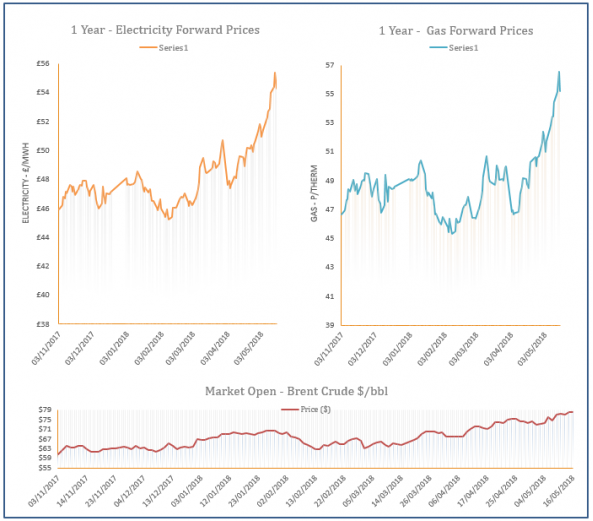
Gas prices displayed mixed movement yesterday with coal and oil markets moving in opposite directions in the afternoon. Following a bullish opening, a warmer weather outlook and an oversupplied system helped towards losses in the afternoon, with a rise in Norwegian flows also a factor.
Energy Market Analysis - 15-05-2018
15th May 2018 | Posted by: Daniel Birkett | Market Analysis
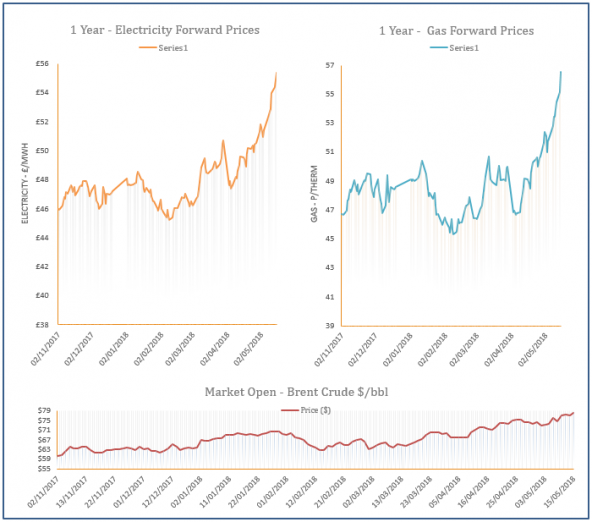
The gas curve remained bullish on Monday with rising oil prices and tighter supply levels providing support. Langeled flows decreased in the afternoon due to three unplanned outages, resulting in an undersupplied system. Cooler weather is also expected towards the end of the week which will lift demand.
Energy Market Analysis - 14-05-2018
14th May 2018 | Posted by: Daniel Birkett | Market Analysis
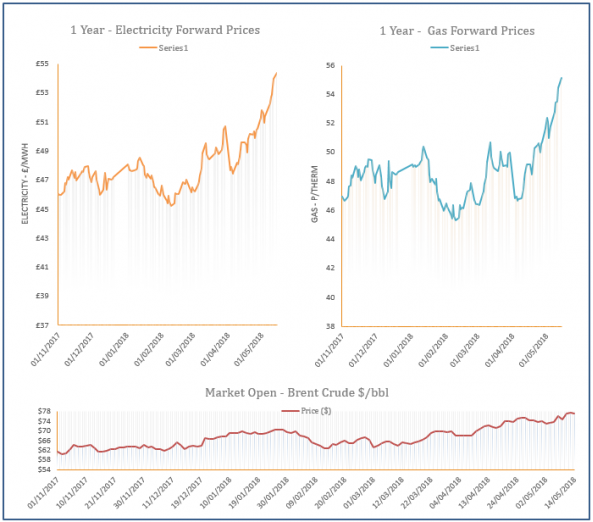
Gas prices were bullish on Friday with an expected rise in gas demand supporting contracts at the front of the curve and stronger coal helping towards increases further out. APi2 coal climbed higher on the back of a supply shortage in South Africa and import restrictions in China.
Energy Market Analysis - 11-05-2018
11th May 2018 | Posted by: Daniel Birkett | Market Analysis
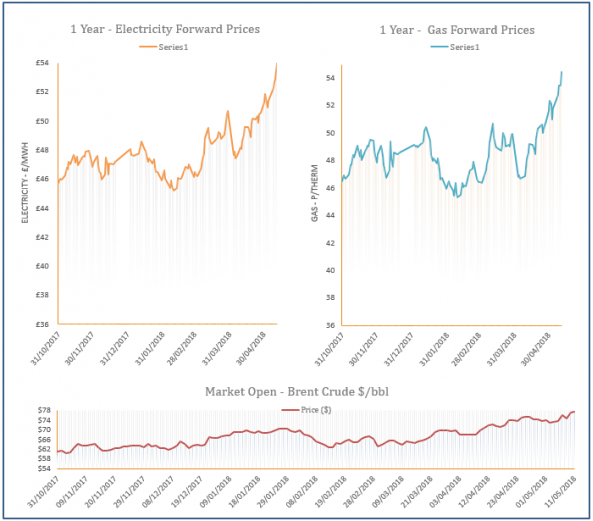
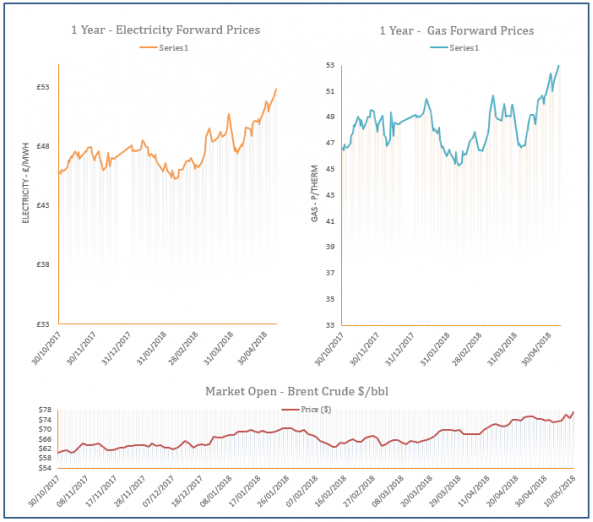
Gas prices strengthened across the board yesterday with support provided by rising oil prices, higher storage injections, unplanned outages and an expected rise in demand. Below average temperatures are forecast for next week which will lead to an increase in residential demand, while US sanctions on Iran has resulted in a bullish oil market.
Energy Market Analysis - 10-05-2018
10th May 2018 | Posted by: Daniel Birkett | Market Analysis
Following a bullish open, the majority of gas contracts declined over the course of Wednesday’s session, with downward pressure provided by a weaker demand forecast. However, the back of the curve was supported by a strengthening oil market as stock levels in the US continue to increase.


