


Energy Market Analysis - 17-09-2018
17th September 2018 | Posted by: Daniel Birkett | Market Analysis
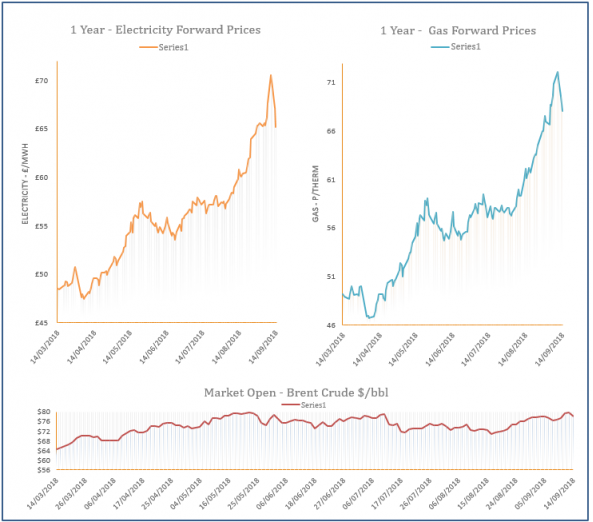
Near-curve gas prices were on the rise on Friday, while contracts further out were mostly flat. Coal and oil prices moved down, limiting upward movement on the far-curve, while a strong carbon market dictated the front of the curve.
Energy Market Analysis – 14-09-2018
14th September 2018 | Posted by: Daniel Birkett | Market Analysis
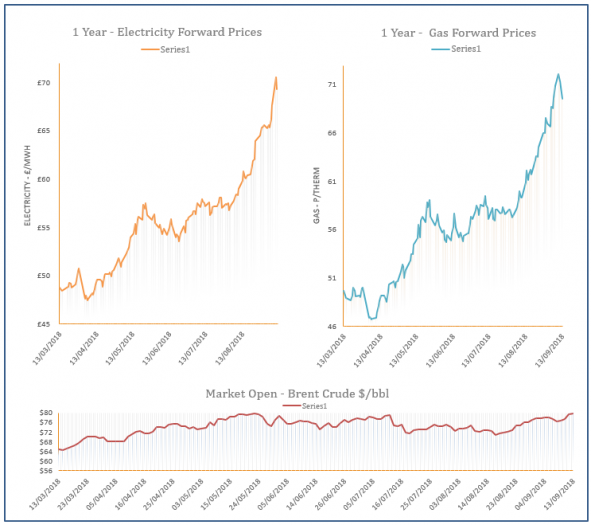
Gas prices were on the decline yesterday with sentiment provided by the overall weakening of European fuel markets. Gas displayed stronger losses than their power counterparts due to a sharp drop in carbon prices, with oil also showing a strong downward correction.
Energy Market Analysis – 13-09-2018
13th September 2018 | Posted by: Daniel Birkett | Market Analysis
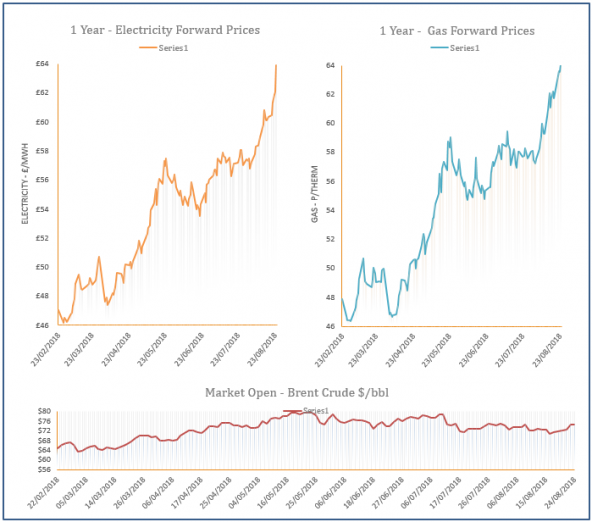
A drop in carbon prices and improved flows from Norway following the end of maintenance helped gas prices move down across the curve yesterday. Improved Russian flows into Europe were also a bearish factor, with a milder weather forecast also contributing to a loss on the prompt.
Energy Market Analysis - 12-09-2018
12th September 2018 | Posted by: Daniel Birkett | Market Analysis
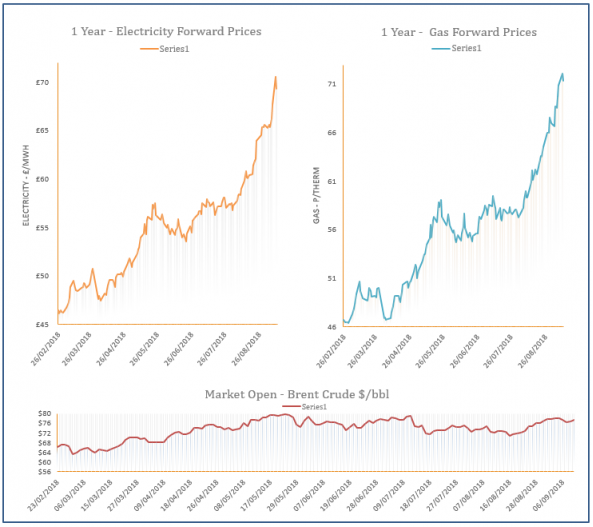
Prompt gas prices decreased on Tuesday thanks to an oversupplied system and a drop in carbon. However, coal and oil prices supported the far-curve. Norwegian flows were expected improve later in the week and mild weather should weigh on demand, adding to the bearish sentiment.
Energy Market Analysis – 11-09-2018
11th September 2018 | Posted by: Lawrence Carson | Market Analysis
With a comfortable supply, European spot power prices should push lower today. Further out, profit taking could potentially end the rally and drive Cal 2019 power prices lower.