


Energy Market Analysis –17-07-2019
17th July 2019 | Posted by: Daniel Birkett | Market Analysis
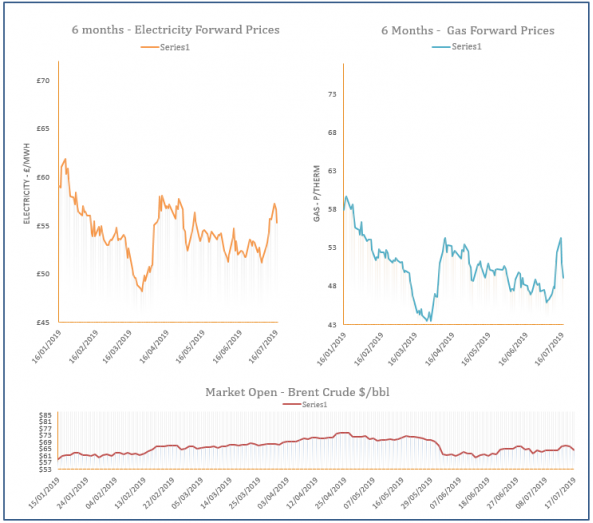
Gas prices displayed further losses yesterday with the Day-Ahead contract shedding around 10% from its price. The losses filtered through to the rest of the near-curve due to improved supply levels, while weaker commodities weighed on the far-curve.

Energy Market Analysis –16-07-2019
16th July 2019 | Posted by: Daniel Birkett | Market Analysis
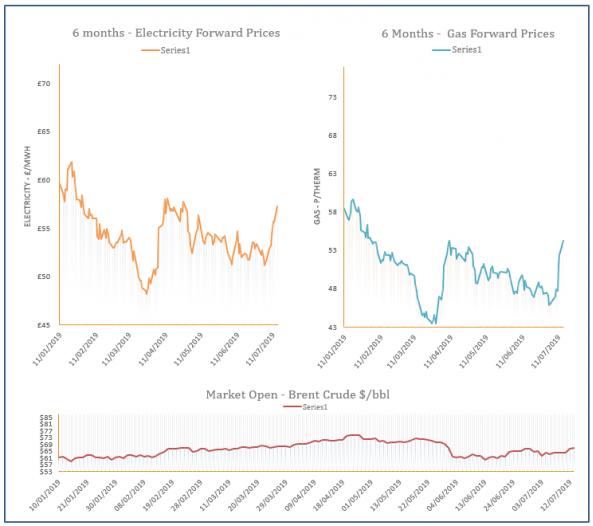
Gas prices displayed early morning gains on Monday on the back of high demand and reduced supply which tightened the system. Meanwhile, coal, carbon and power markets rallied higher, providing additional strength to the far-curve. However, most prices displayed a downward correction later in the afternoon.
Energy Market Analysis - 15-07-2019
15th July 2019 | Market Analysis
Gas prices moved higher of Friday, outpacing moves in the broader energy complex which saw more modest gains in oil, power and carbon, coal closed out the day lower.
Energy Market Analysis –12-07-2019
12th July 2019 | Posted by: Daniel Birkett | Market Analysis
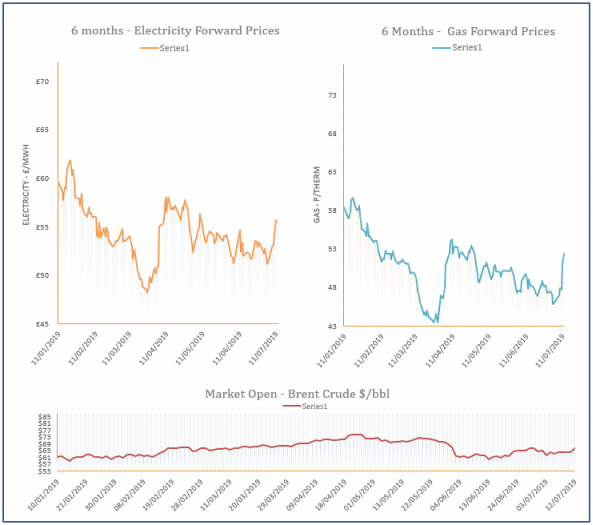
The UK gas system was 18mcm short yesterday due to strong gas-fired power demand and restricted flows. This helped to lift prices across the near-curve, whereas the far-curve found support from a sharp rise in oil, while carbon continued its bullish trend.

Energy Market Analysis –11-07-2019
11th July 2019 | Posted by: Daniel Birkett | Market Analysis
Gas prices moved higher yesterday as Co2 prices hit an eleven year high, with coal and oil also showing an increase. The system was also undersupplied due to a rise in gas-fired power, weaker LNG send-outs and restricted Norwegian flows.