


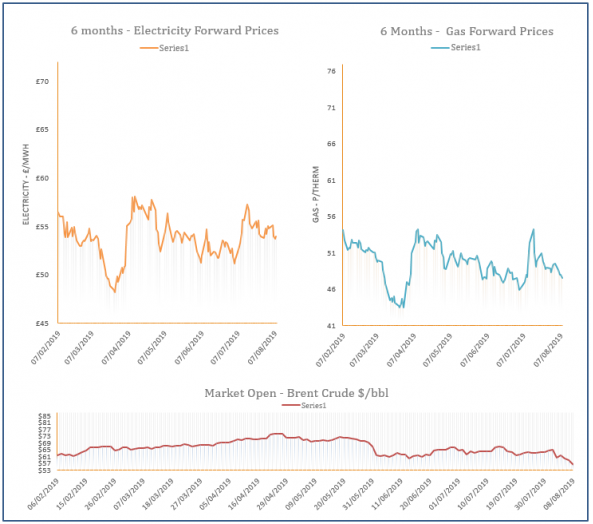
Energy Market Analysis –08-08-2019
8th August 2019 | Posted by: Daniel Birkett | Market Analysis
Gas prices were largely unchanged for the majority of Wednesday’s session but ended the day with mixed changes. Falling oil had little impact on the far-curve, with coal and carbon also showing a decrease.

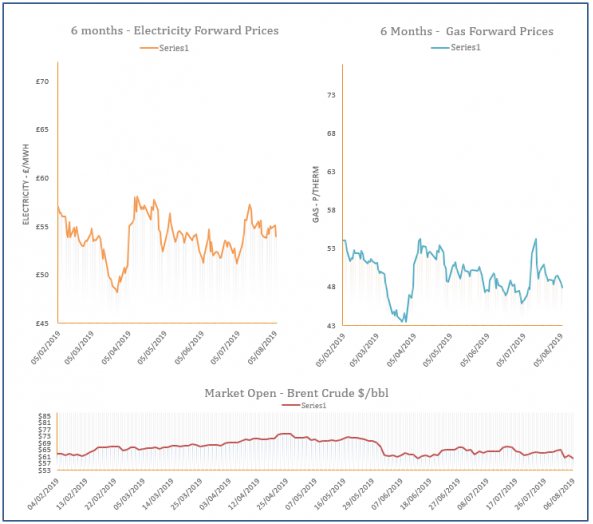
Energy Market Analysis –07-08-2019
7th August 2019 | Posted by: Daniel Birkett | Market Analysis
Gas prices remained bearish on Tuesday, following global commodities which saw a large sell-off due to weak oil demand and the US/ Chinese trade war. Oil and coal displayed strong losses, weighing on the far-curve, while planned maintenance in Norway limited losses at the front of the curve.
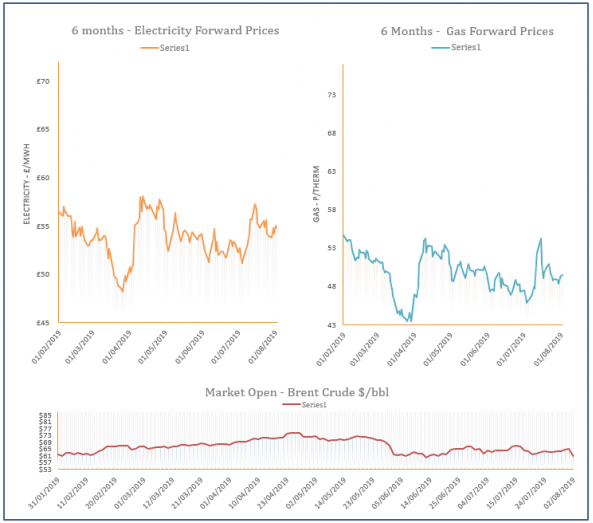
Energy Market Analysis –06-08-2019
6th August 2019 | Posted by: Daniel Birkett | Market Analysis
Near-curve gas prices recorded losses on the back of an oversupplied system and a healthy LNG outlook. The losses filtered through to the rest of the curve with bearish coal and oil markets weighing on longer dated contracts.

Energy Market Analysis –05-08-2019
5th August 2019 | Posted by: Daniel Birkett | Market Analysis
Gas prices fluctuated throughout Friday’s session as bearish pressure was provided by coal and carbon, while oil displayed a rebound which supported contracts in the afternoon. Meanwhile, the supply/ demand outlook was unchanged, offering little direction to the prompt.
Energy Market Analysis –02-08-2019
2nd August 2019 | Posted by: Daniel Birkett | Market Analysis
Gas prices increased yesterday with bullish pressure provided by a rise in coal, power and carbon. The far-curve held firm despite a sharp drop in oil, while the supply outlook was unchanged, providing little direction to the prompt.