


Energy Market Analysis – 15-01-2021
15th January 2021 | Posted by: Daniel Birkett | Market Analysis
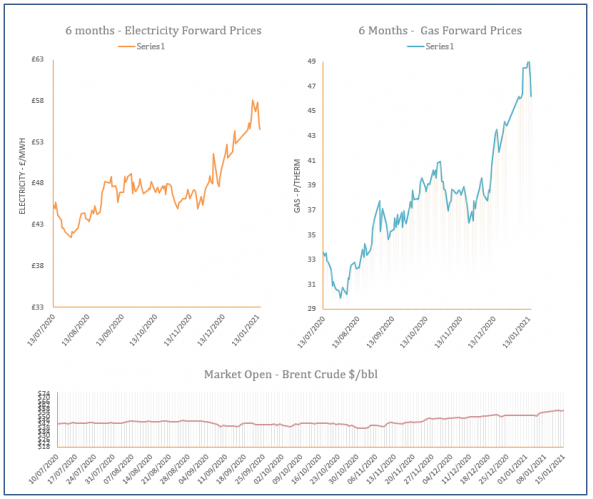
An upward revision in temperatures for the 14-day weather forecast, helped near curve gas prices shed from their price yesterday, while movement further out was stable-to-bearish.
Energy Market Analysis – 14-01-2021
14th January 2021 | Posted by: Daniel Birkett | Market Analysis
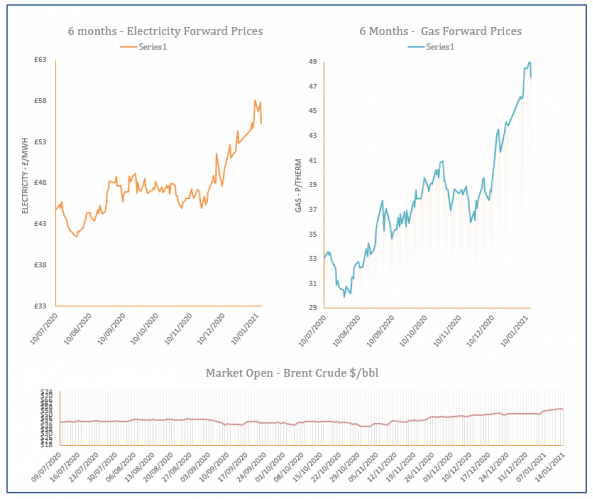
Gas prices ended the session lower on Wednesday, erasing some of the strong gains recorded in the previous session as European markets remained volatile. Low LNG send-outs were offset by healthy imports, while cold weather kept demand levels high.
Energy Market Analysis – 13-01-2021
13th January 2021 | Posted by: Daniel Birkett | Market Analysis
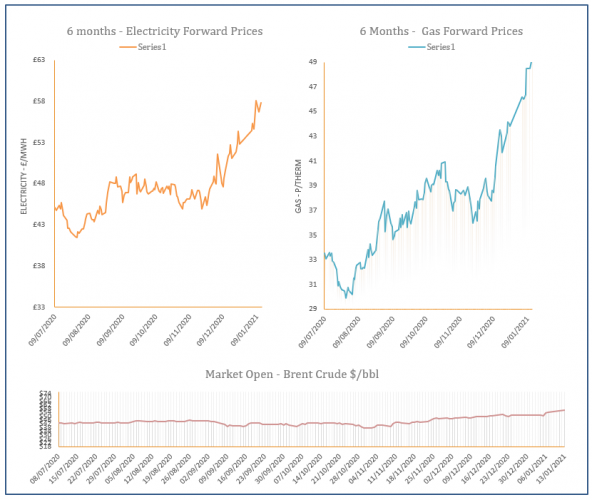
Gas prices were volatile throughout Tuesday’s session, with the Day-Ahead contract hitting its highest level since 2018 and the February Front-Month contract reaching a high not seen since 2008!
Energy Market Analysis – 11-01-2021
11th January 2021 | Posted by: Daniel Birkett | Market Analysis
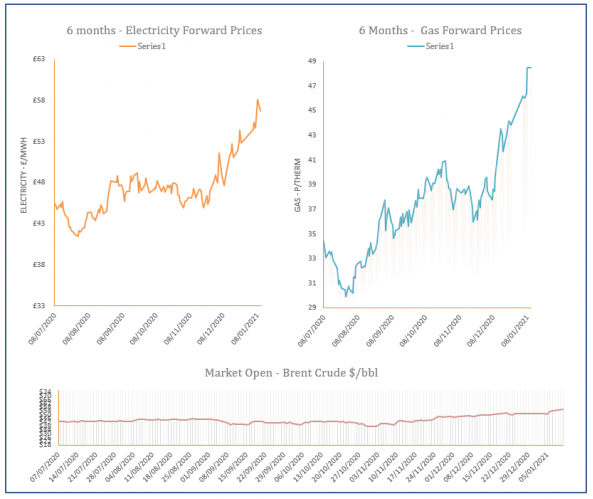
Sentiment on the gas curve was little changed throughout the week, with the front of the curve influenced by cold weather and reduced LNG send-outs. Meanwhile, oil and carbon markets continued their bullish trend, supporting the far curve.
Energy Market Analysis – 08-01-2021
8th January 2021 | Posted by: Daniel Birkett | Market Analysis
Gas prices continued to climb higher yesterday as sentiment has been little changed this week. Support was provided by demand levels which were 70mcm above the seasonal norm, while oil and carbon markets also traded higher.