


Apollo Energy publishes a daily energy market analysis, focusing on the gas, power and oil markets including a commentary on how the markets close and open. Our analysis provides insight on how the markets are performing and also considers various factors which could dictate price changes in the future.
The analysis also contains a graph which tracks the one-year forward price of both gas and electricity as well as changes to Brent crude oil.
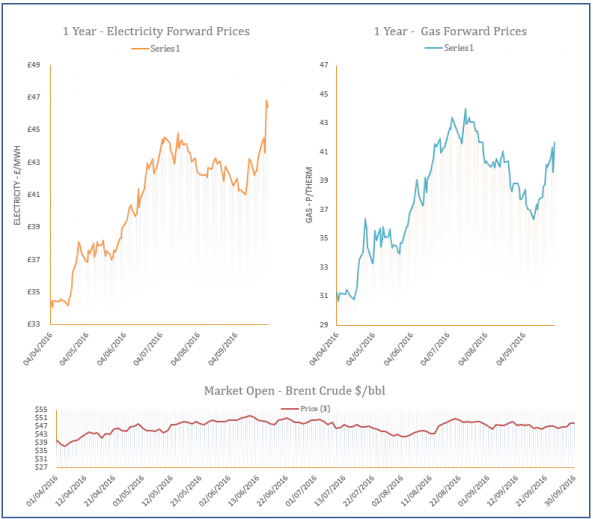
Energy Market Analysis - 30-09-2016
30th September 2016 | Posted by: Daniel Birkett | Market Analysis
Gas prices posted gains on Thursday ahead of the expiration of a number of contracts, with strong upward movement on the commodity market also a key factor. Oil prices increased on the back of Wednesday’s announcement in regards to production cuts which supported the far-curve. A weaker supply picture also provided bullish pressure at the front of the curve following another drop in Norwegian flows, while a weaker wind forecast will result in higher gas-fired power generation.

Market Update - OPEC Ministers announce production cut
29th September 2016 | Posted by: Daniel Birkett | Industry News
OPEC members have agreed to a preliminary deal to cut output for the first time in eight years which has resulted in increased oil prices.
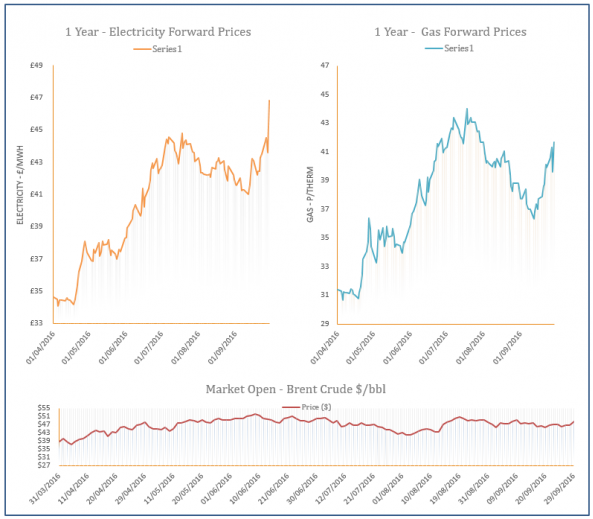
Energy Market Analysis - 29-09-2016
29th September 2016 | Posted by: Daniel Birkett | Market Analysis
Unplanned outages at Norwegian facilities resulted in bullish movement on the near gas curve yesterday afternoon; maintenance at the Skarv field has reduced export capacity in Norway by 10mcm. Further out, contracts found support from a jump in oil prices as it was announced that major oil producers have agreed to production cuts.
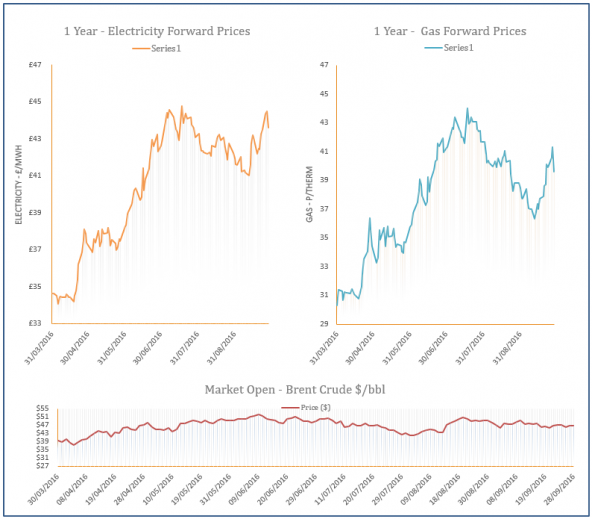
Energy Market Analysis - 28-09-2016
28th September 2016 | Posted by: Daniel Birkett | Market Analysis
A combination of improved Norwegian flows, a weaker demand outlook and a drop in oil prices resulted in bearish movement across the gas curve on Tuesday afternoon. However, the UK gas system was short due to an unexpected outage at the St Fergus terminal, despite reduced gas-fired generation. Elsewhere, Shell have announced that a further two compressors will be installed at the Ormen Lange gas field next year which will increase capacity by 20mcm.
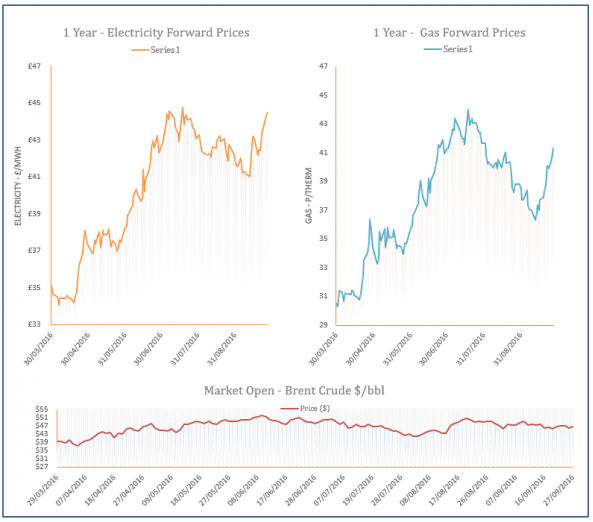
Energy Market Analysis - 27-09-2016
27th September 2016 | Posted by: Daniel Birkett | Market Analysis
Gas prices displayed mixed movement during yesterday's session as contracts on the near-curve found support from weaker Norwegian supply which was caused by unplanned outages. In contrast, far-curve contracts decreased despite a jump in oil prices as traders corrected down from last week;s strong gains.