


Apollo Energy publishes a daily energy market analysis, focusing on the gas, power and oil markets including a commentary on how the markets close and open. Our analysis provides insight on how the markets are performing and also considers various factors which could dictate price changes in the future.
The analysis also contains a graph which tracks the one-year forward price of both gas and electricity as well as changes to Brent crude oil.
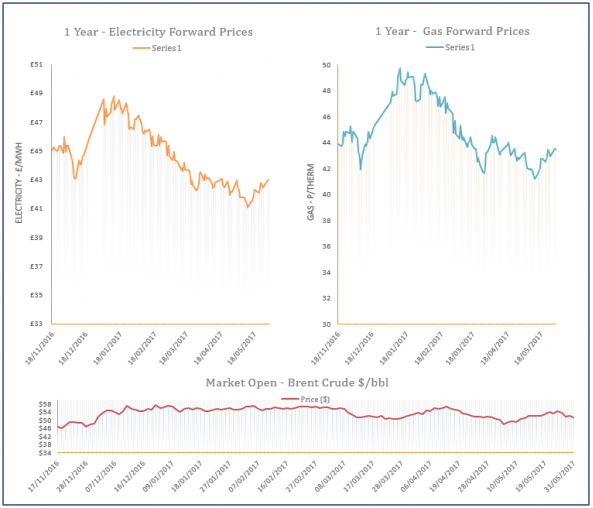
Energy Market Analysis - 31-05-2017
31st May 2017 | Posted by: Daniel Birkett | Market Analysis
Gas prices moved higher on Tuesday with support coming from rising coal and power markets, with an expected drop in temperatures next week also a factor. Meanwhile, Langeled flows were lower due to an unplanned outage at the Nyhamna processing plant which led to a tighter UK gas system, despite weak demand.
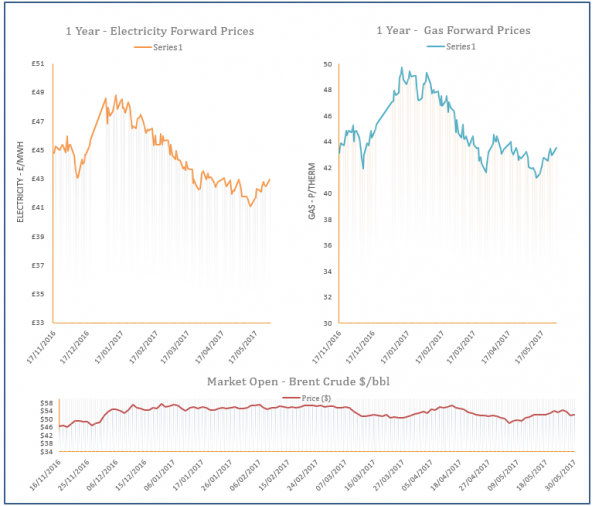
Energy Market Analysis - 30-05-2017
30th May 2017 | Posted by: Daniel Birkett | Market Analysis
UK markets were closed yesterday due to the bank holiday but the majority of contracts ended Friday’s session at a discount. Warm weather over the weekend helped to reduce demand levels as expected, while the outlook for oil was bearish following the OPEC meeting. In terms of supply, exports via the IUK pipeline were very strong, helping to weigh on European prices.
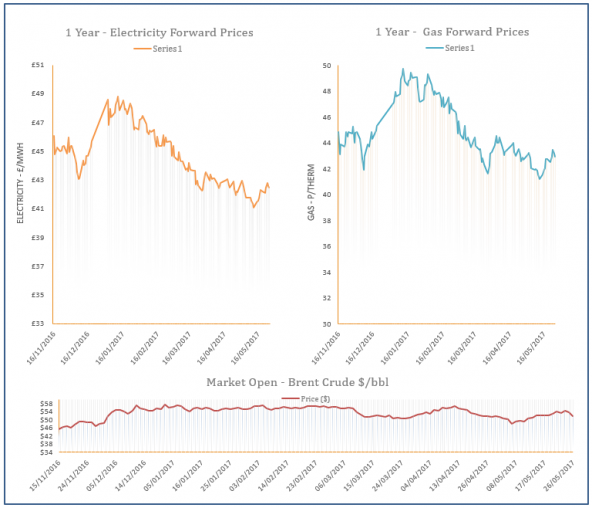
Energy Market Analysis - 26-05-2017
26th May 2017 | Posted by: Daniel Birkett | Market Analysis
The morning session was generally stable but small losses were recorded in the afternoon following a drop in oil prices and a warm weather outlook for today. A number of LNG deliveries are also expected to dock in the UK in the coming days and helped to counter the effects of a short system.

DONG Energy sell oil and gas arm to Ineos
25th May 2017 | Posted by: Daniel Birkett | Industry News
Danish utility giant and wind farm developer, DONG Energy has announced the sale of its oil and gas business for $1.3bn.

Energy Market Analysis - 25-05-2017
25th May 2017 | Posted by: Daniel Birkett | Market Analysis
It was announced yesterday that production at the Groningen gas facility would be cut by 10%, falling from 24bcm to 21.6bcm; additional restrictions will also be placed on output in colder years. This news offered some support to the curve later in the session but a warm weather outlook and the expected arrival of LNG deliveries in the coming week helped to restrict any gains.