


Apollo Energy publishes a daily energy market analysis, focusing on the gas, power and oil markets including a commentary on how the markets close and open. Our analysis provides insight on how the markets are performing and also considers various factors which could dictate price changes in the future.
The analysis also contains a graph which tracks the one-year forward price of both gas and electricity as well as changes to Brent crude oil.
Energy Market Analysis - 07-07-2017
7th July 2017 | Posted by: Daniel Birkett | Market Analysis
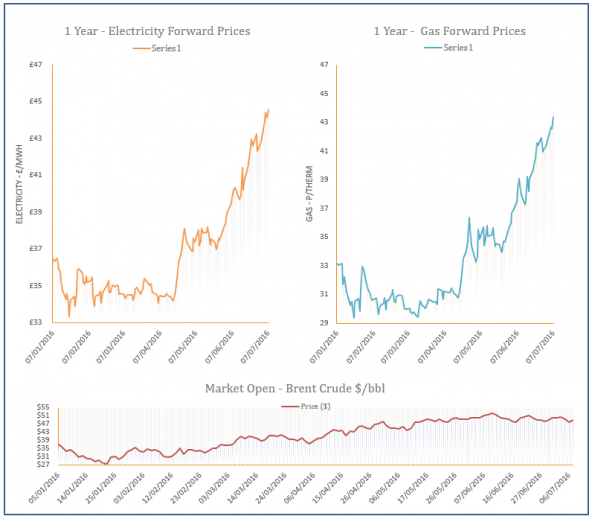
Most gas contracts were range-bound yesterday with no major shifts in terms of fundamentals. LNG send-outs are expected to remain healthy throughout July and Norwegian flows will rise today with the return of the Gjoa platform, weighing on the prompt. Meanwhile, rebounds on coal and oil markets offered some support on the far-curve.
Energy Market Analysis - 06-07-2017
6th July 2017 | Posted by: Daniel Birkett | Market Analysis
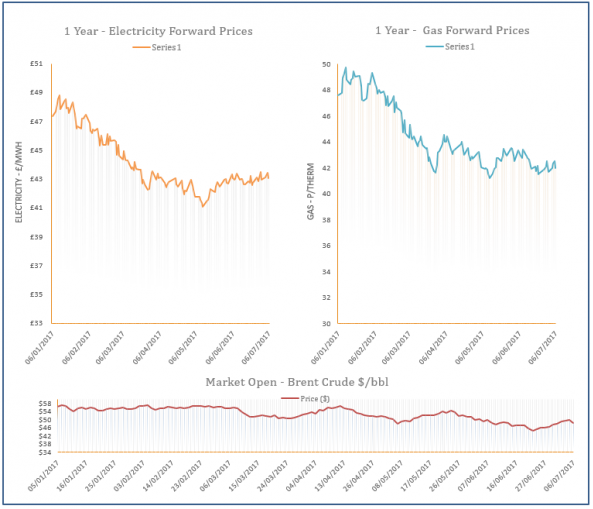
Movement along the gas curve was minimal yesterday afternoon as supply levels were comfortable, helping to restrict any upward pressure provided by stronger coal prices. In other news, the first ever US LNG delivery to the UK is expected in the near future, providing some bearish pressure at the start of the session.
Energy Market Analysis - 05-07-2017
5th July 2017 | Posted by: Daniel Birkett | Market Analysis
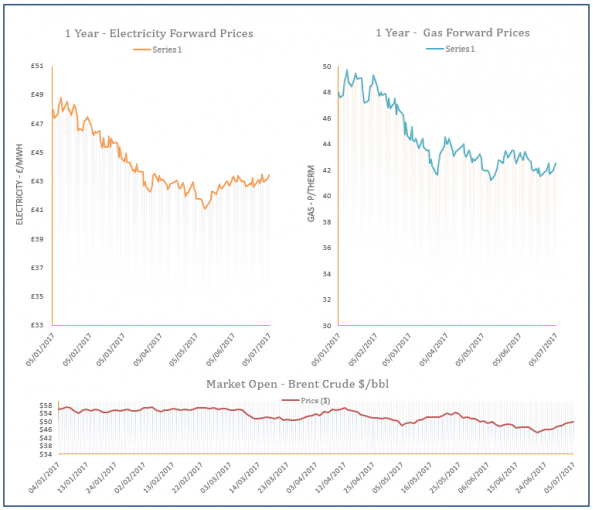
Movement on the gas curve was generally bearish yesterday, with little support provided by oil as markets were closed for American Independence Day. Supply levels were comfortable despite higher CCGT demand as LNG send-outs ramped up following several deliveries.

Energy Market Analysis - 04-07-2017
4th July 2017 | Posted by: Daniel Birkett | Market Analysis
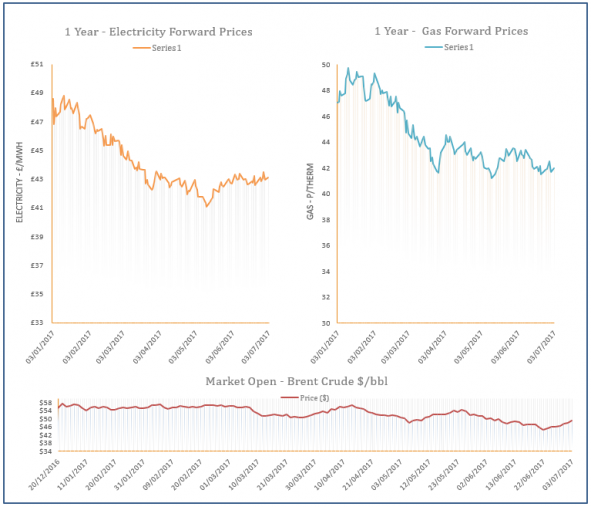
The UK gas system was short throughout yesterday’s session with exports to Europe at full capacity, while an outage at the Entry Segal pipeline also limited supply. A significant drop in wind levels was also expected to increase gas-fired power generation today. This weak supply picture resulted in gains across the curve, with bullish oil also a factor.
Energy Market Analysis - 03-07-2017
3rd July 2017 | Posted by: Daniel Birkett | Market Analysis
Gas prices displayed losses on Friday afternoon following a rise in Norwegian flows, resulting in an oversupplied system. The LNG outlook for this week is also healthy, further weighing on near-curve prices. Meanwhile, movement on the coal and oil markets was minimal, providing little support to the far-curve.