


Apollo Energy publishes a daily energy market analysis, focusing on the gas, power and oil markets including a commentary on how the markets close and open. Our analysis provides insight on how the markets are performing and also considers various factors which could dictate price changes in the future.
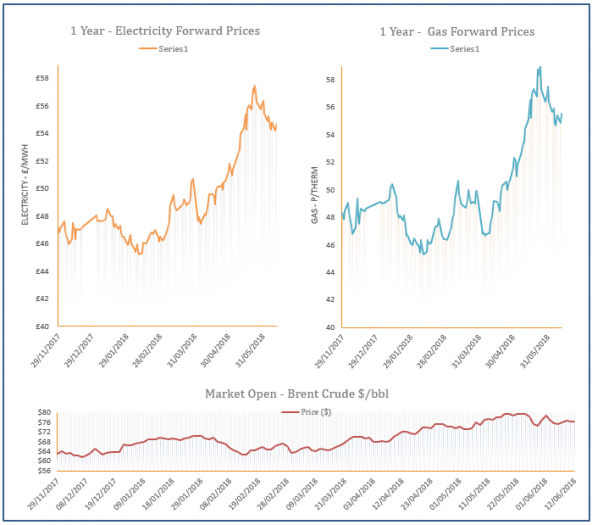
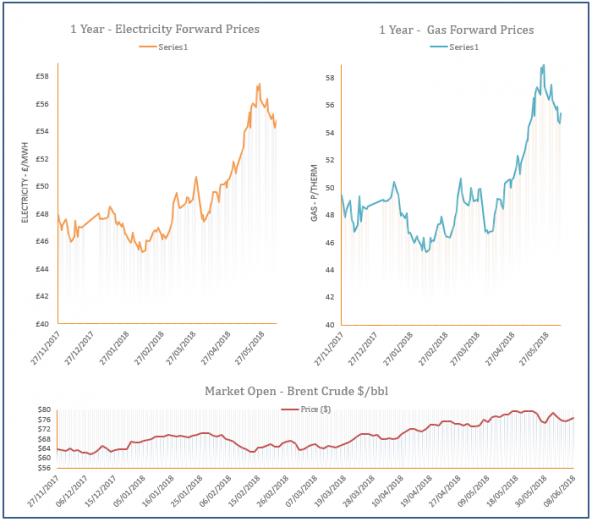
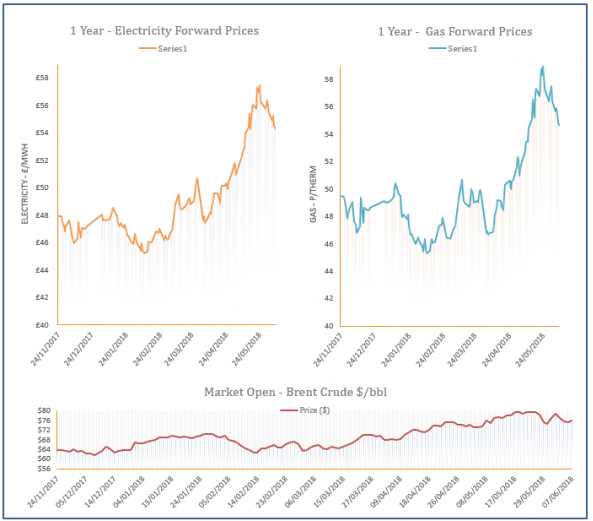
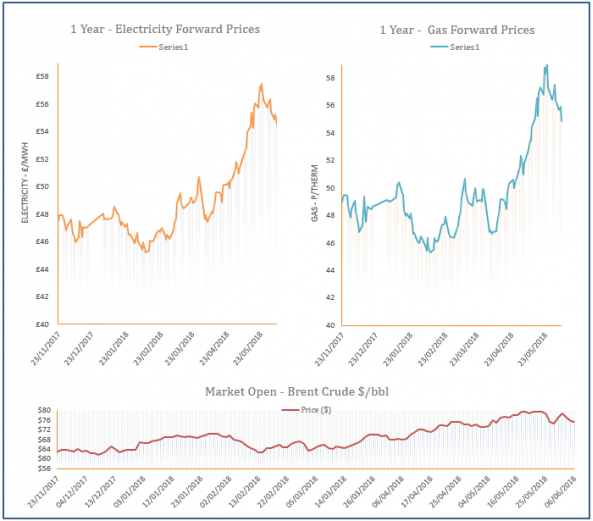
The analysis also contains a graph which tracks the one-year forward price of both gas and electricity as well as changes to Brent crude oil.
Energy Market Analysis - 12-06-2018
12th June 2018 | Posted by: Daniel Birkett | Market Analysis
Near-curve gas prices moved down on Monday as Norwegian flows ramped up, contributing to an oversupplied system. A slight rise in renewable power also helped to reduce CCGT demand. Further out, prices were pressured down by bearish coal and oil markets.

Energy Market Analysis - 11-06-2018
11th June 2018 | Posted by: Daniel Birkett | Market Analysis
Gas prices were bullish at the start of Friday’s session with support coming from the Netherlands, as the Dutch government revealed its plans to cut production at Groningen at a quicker rate. However, prices decreased later in the session on the back of weaker fuel markets and a low demand outlook.
Energy Market Analysis - 08-06-2018
8th June 2018 | Posted by: Daniel Birkett | Market Analysis
Production cuts at the Groningen gas facility are expected to come into effect sooner than expected, providing support to European markets yesterday. On-going outages also limited flows to the UK resulting in an undersupplied system, offering further support to prompt prices. Meanwhile, rising oil and coal markets helped far-curve prices climb higher.
Energy Market Analysis - 07-06-2018
7th June 2018 | Posted by: Daniel Birkett | Market Analysis
Gas prices displayed further losses on Wednesday despite on-going outages which restricted flows to the UK. A weak demand forecast was the main factor behind decreases at the front of the curve, while the far-curve was pressured down by bearish coal and carbon markets.
Energy Market Analysis - 06-06-2018
6th June 2018 | Posted by: Daniel Birkett | Market Analysis
Gas prices moved higher on Tuesday morning but the trend reversed in the afternoon as coal, carbon and oil markets turned bearish, while the Pound strengthened against the Euro. The short-term demand forecast is also low due to warm temperatures, weighing on prices at the front of the curve.