


Energy Market Analysis - 29-06-2018
29th June 2018 | Posted by: Daniel Birkett | Market Analysis
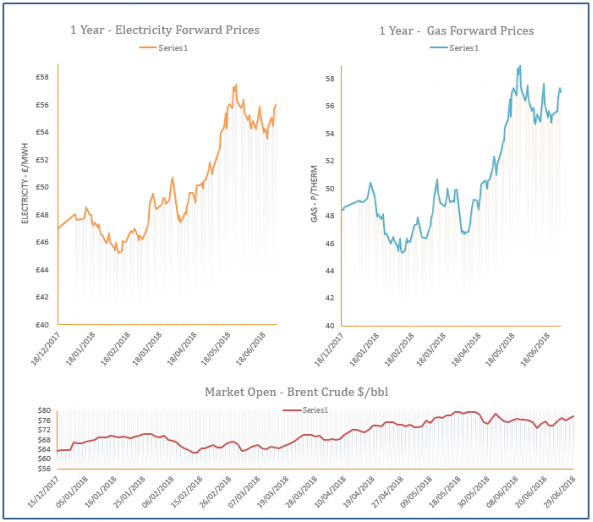
Prompt gas prices stabilised yesterday afternoon following early morning losses, although some far-curve prices found support from a rise in Brent. The return of the interconnector resulted in an increase in exports to mainland Europe but the UK system remained oversupplied despite higher gas-fired power demand.
Energy Market Analysis - 28-06-2018
28th June 2018 | Posted by: Daniel Birkett | Market Analysis
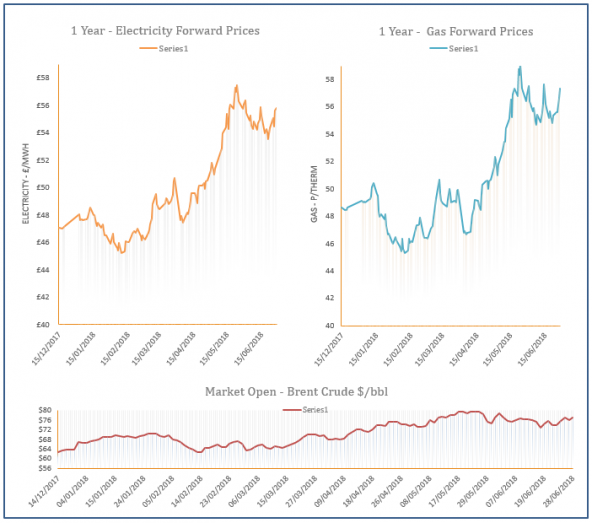
Gas prices displayed strong gains yesterday with an on-going issue at Elgin-Franklin and unplanned outages in Norway restricting flows to the UK. Exports to mainland Europe were also expected to resume today as the IUK pipeline is scheduled to restart. Oil and coal markets also displayed a rebound which transferred to far-curve gas contracts.

Energy Market Analysis - 27-06-2018
27th June 2018 | Posted by: Daniel Birkett | Market Analysis
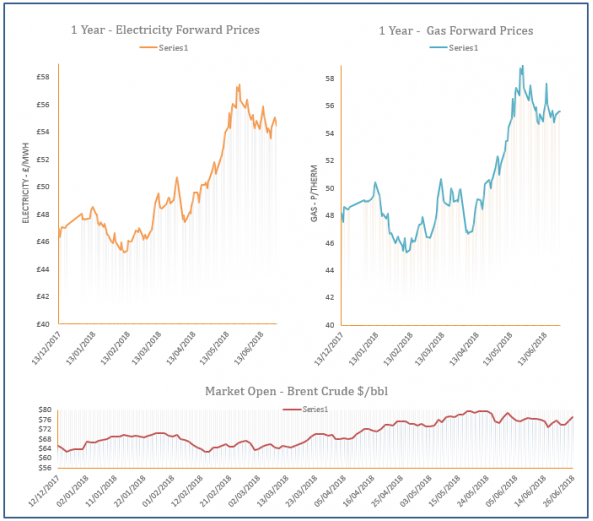
Gas prices displayed losses across the curve on Tuesday as the system was oversupplied due to low demand and improved flows from Norway. The warm weather outlook is set to continue into the weekend, which further weighed on the prompt. However, downward movement at the back of the curve was restricted by a bullish outlook for coal and oil.
Energy Market Analysis - 26-06-2018
26th June 2018 | Posted by: Daniel Birkett | Market Analysis
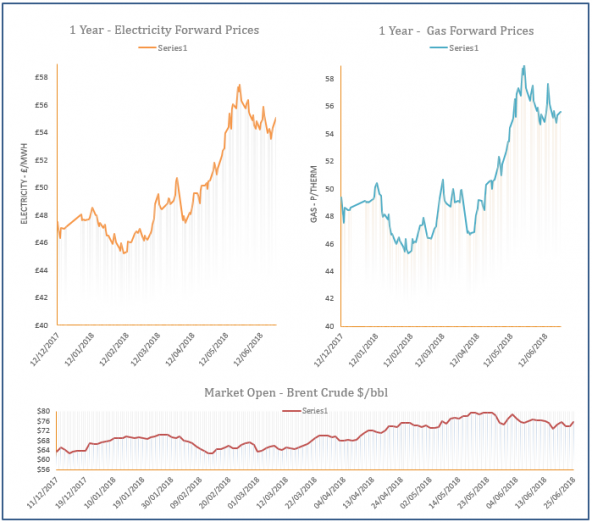
Gas prices displayed mixed movement yesterday with losses recorded at the front of the curve and gains further out. Warm weather continued to weigh on demand levels and Norwegian flows increased, contributing to a long system. Meanwhile, a sharp rise in oil prices was the cause behind upward movement at the back of the curve.
Energy Market Analysis - 25-06-2018
25th June 2018 | Posted by: Daniel Birkett | Market Analysis
Gas prices moved higher during Friday’s afternoon session with direction coming from the oil market, with the latest OPEC meeting the main market driver. Despite the afternoon gains, the overall context at the front of the curve was bearish with healthy wind levels reducing CCGT demand and Norwegian flows increasing following the end of planned outages.