


Apollo Energy publishes a daily energy market analysis, focusing on the gas, power and oil markets including a commentary on how the markets close and open. Our analysis provides insight on how the markets are performing and also considers various factors which could dictate price changes in the future.
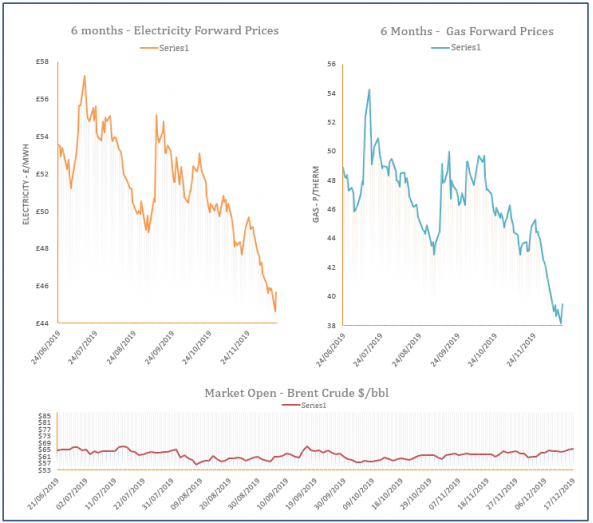
The analysis also contains a graph which tracks the one-year forward price of both gas and electricity as well as changes to Brent crude oil.
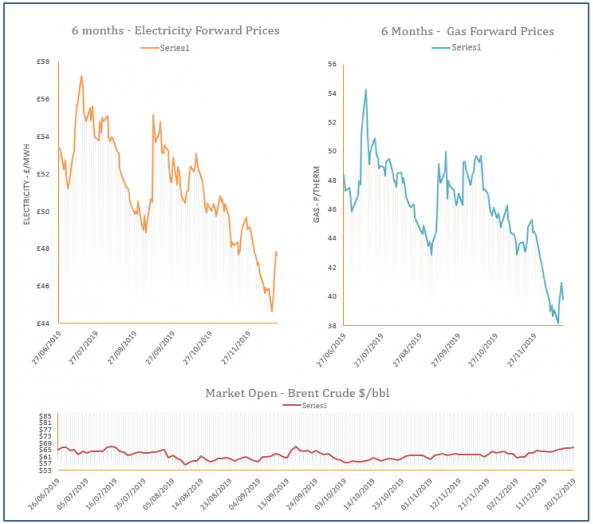
Energy Market Analysis – 20-12-2019
20th December 2019 | Posted by: Daniel Birkett | Market Analysis
Gas prices displayed strong fluctuations yesterday, with losses in the morning and recoveries in the afternoon. Putin’s comments in regards to a gas transit deal with Ukraine contributed to bearish sentiment at the start of the session, but uncertainty resulted in some buying action on energy markets later in the day.
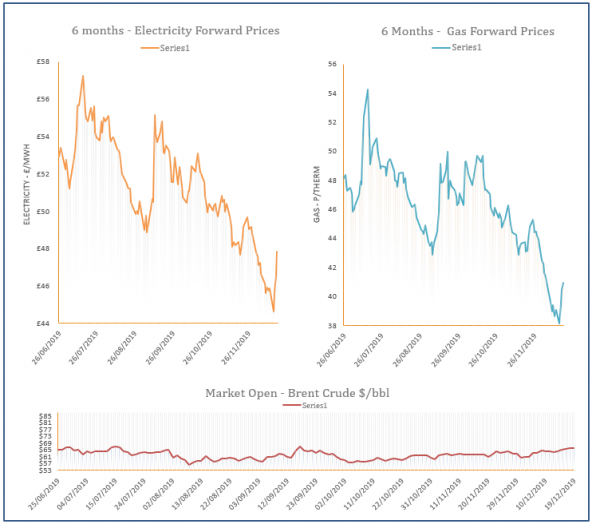
Energy Market Analysis – 19-12-2019
19th December 2019 | Posted by: Daniel Birkett | Market Analysis
Gas prices displayed further gains by the end of yesterday’s session despite a bearish open. Bullish pressure was provided by an announcement from Naftogaz, the Ukrainian pipeline operator which revealed that no gas transit deal will be agreed with Russia before the end of the year.
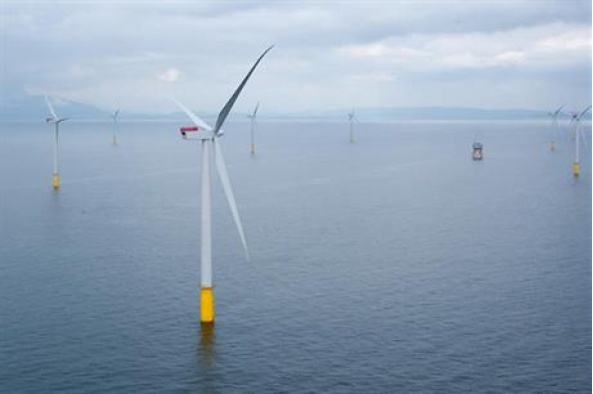
Offshore wind integration can help deliver the UK’s zero carbon targets
19th December 2019 | Posted by: Daniel Birkett | Industry News
A new report, titled ‘UK Continental Shelf (UKCS) Energy Integration’ published by the Oil and Gas Authority (OGA) outlines how increased integration between offshore wind & offshore oil & gas production could help the UK meet its environmental targets.
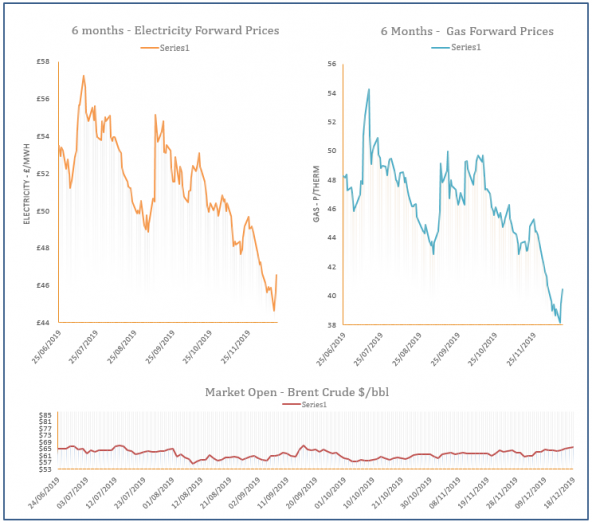
Energy Market Analysis – 18-12-2019
18th December 2019 | Posted by: Daniel Birkett | Market Analysis
Gas prices continued to move higher yesterday, with near-curve contracts finding support from a short system, caused by increased demand levels. Meanwhile, the far-curve was pushed higher by stronger commodity markets, with coal, carbon and oil all displaying gains.
Energy Market Analysis – 17-12-2019
17th December 2019 | Posted by: Daniel Birkett | Market Analysis
The majority of gas prices displayed a rebound yesterday, with the near-curve finding strength from an undersupplied system. Meanwhile, contracts further along the curve were pushed higher by a rise in carbon and oil.